

Tabs
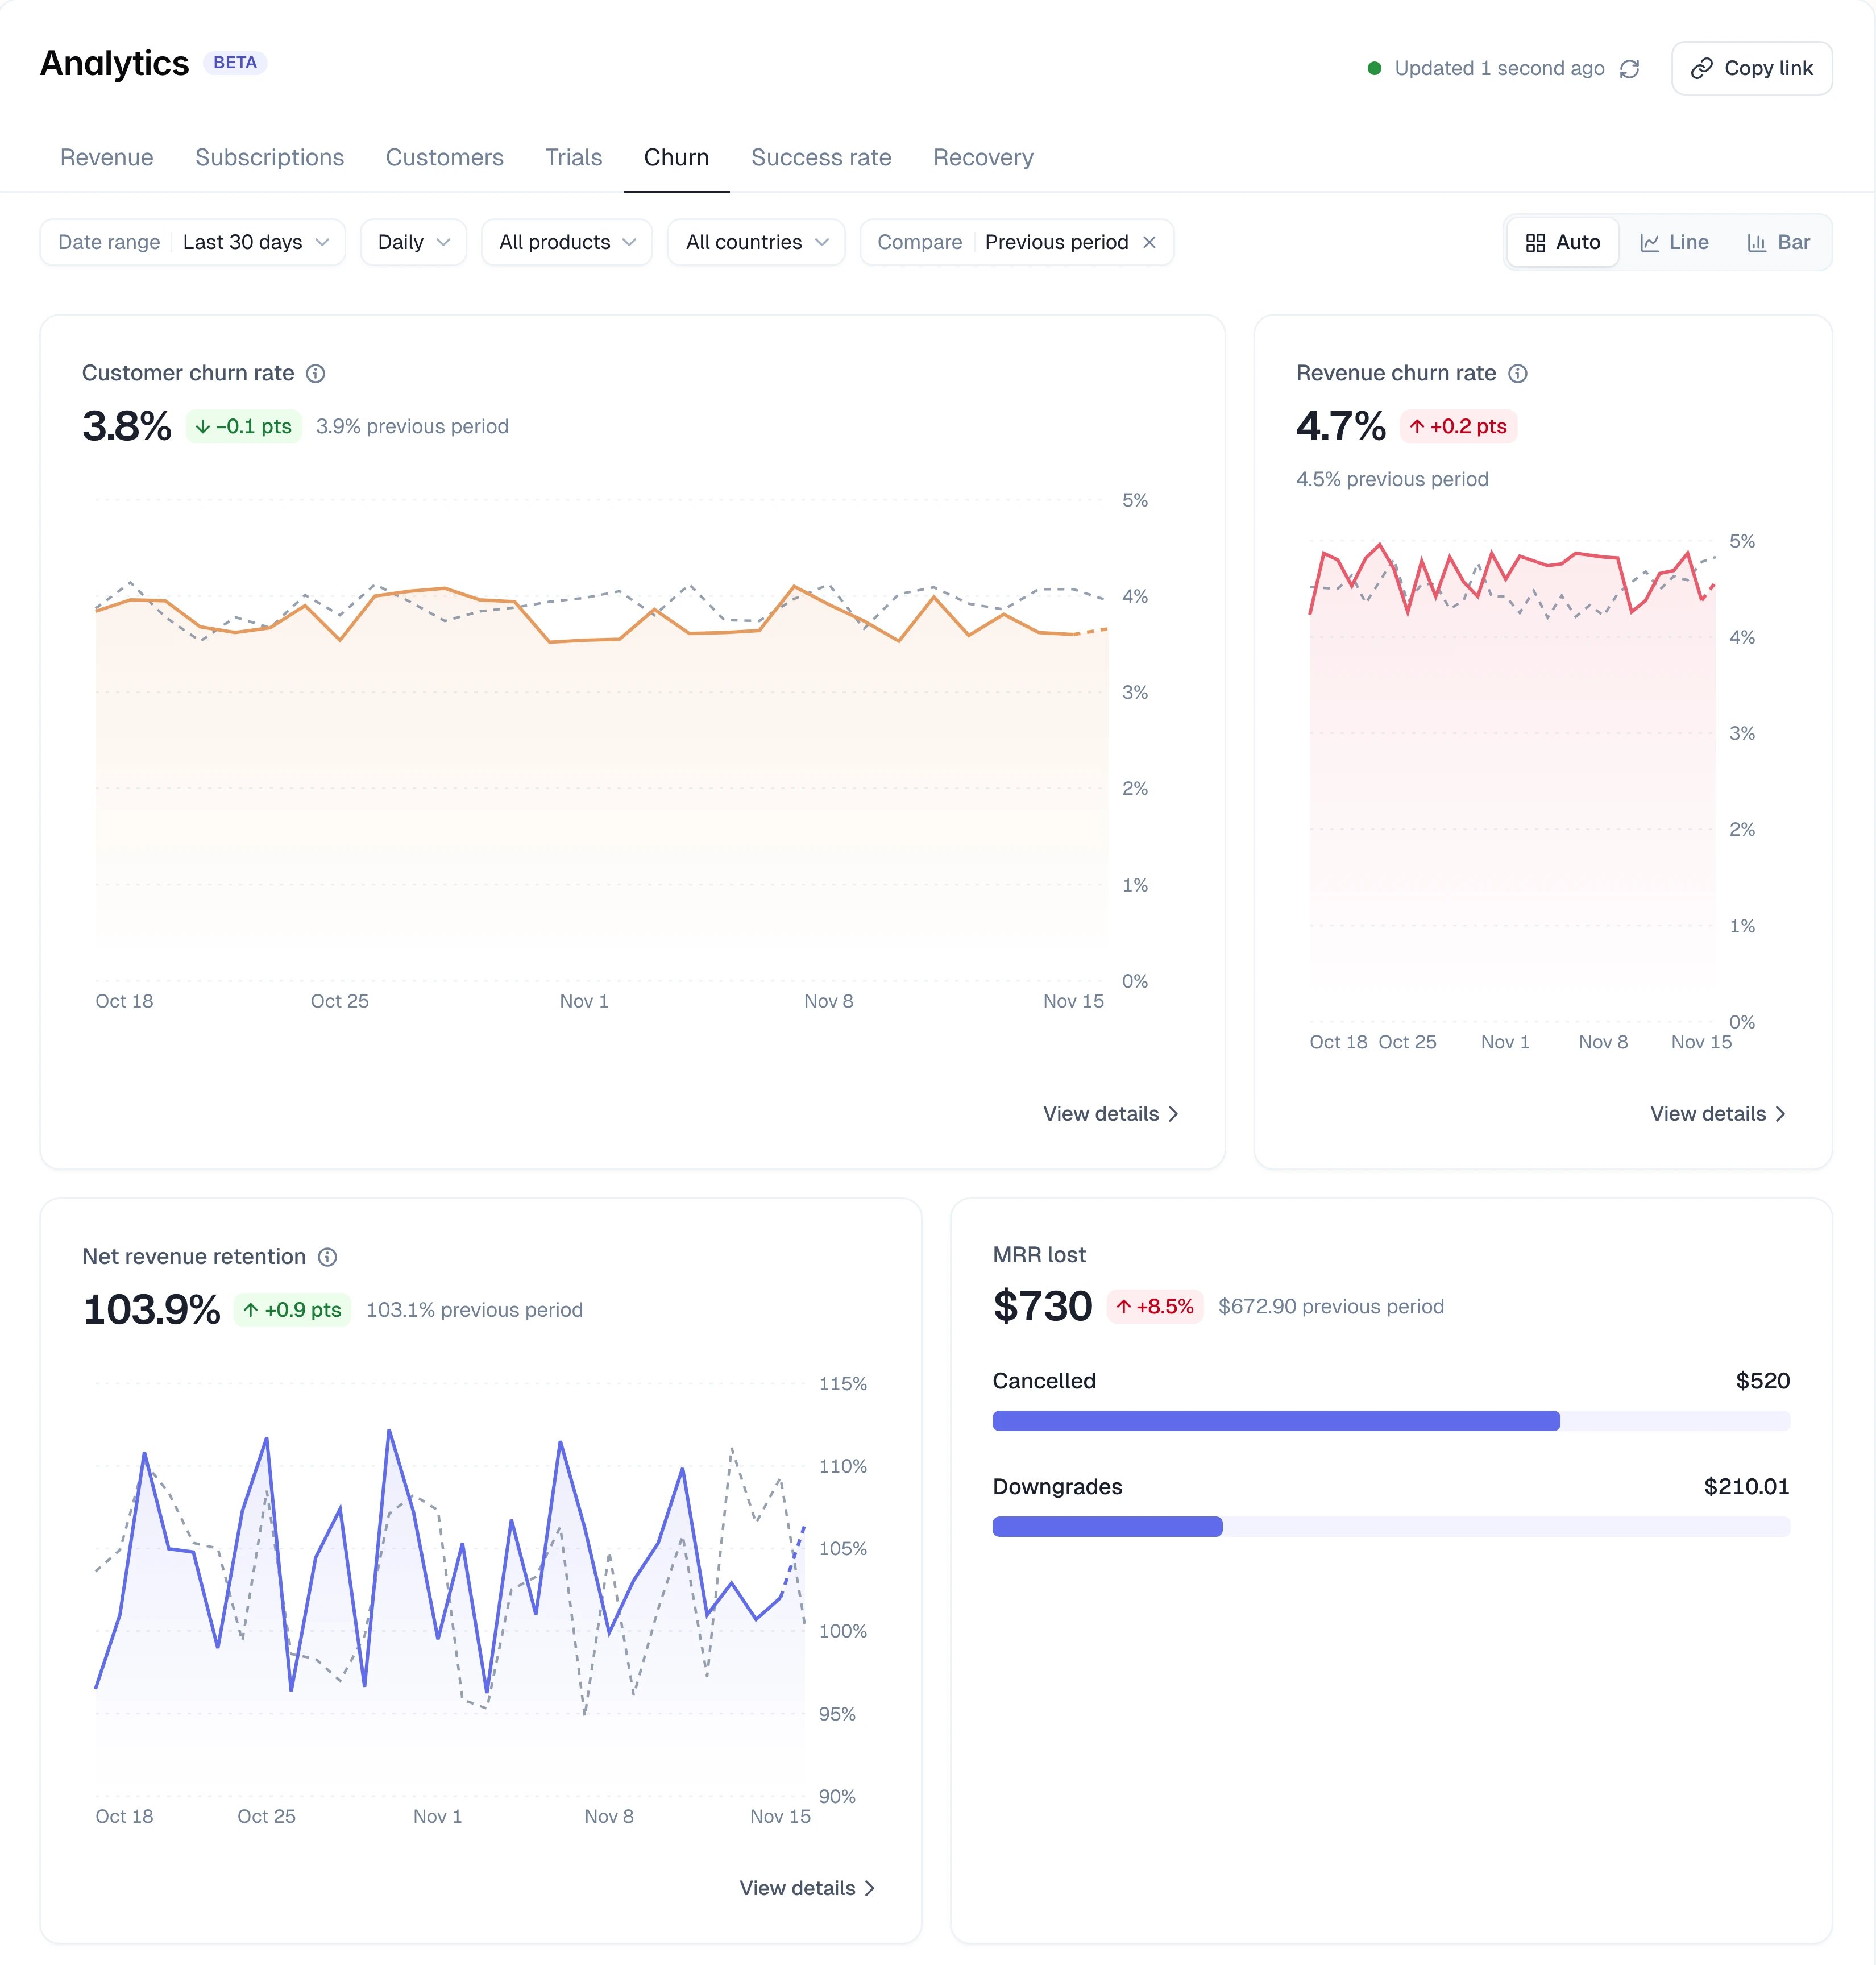
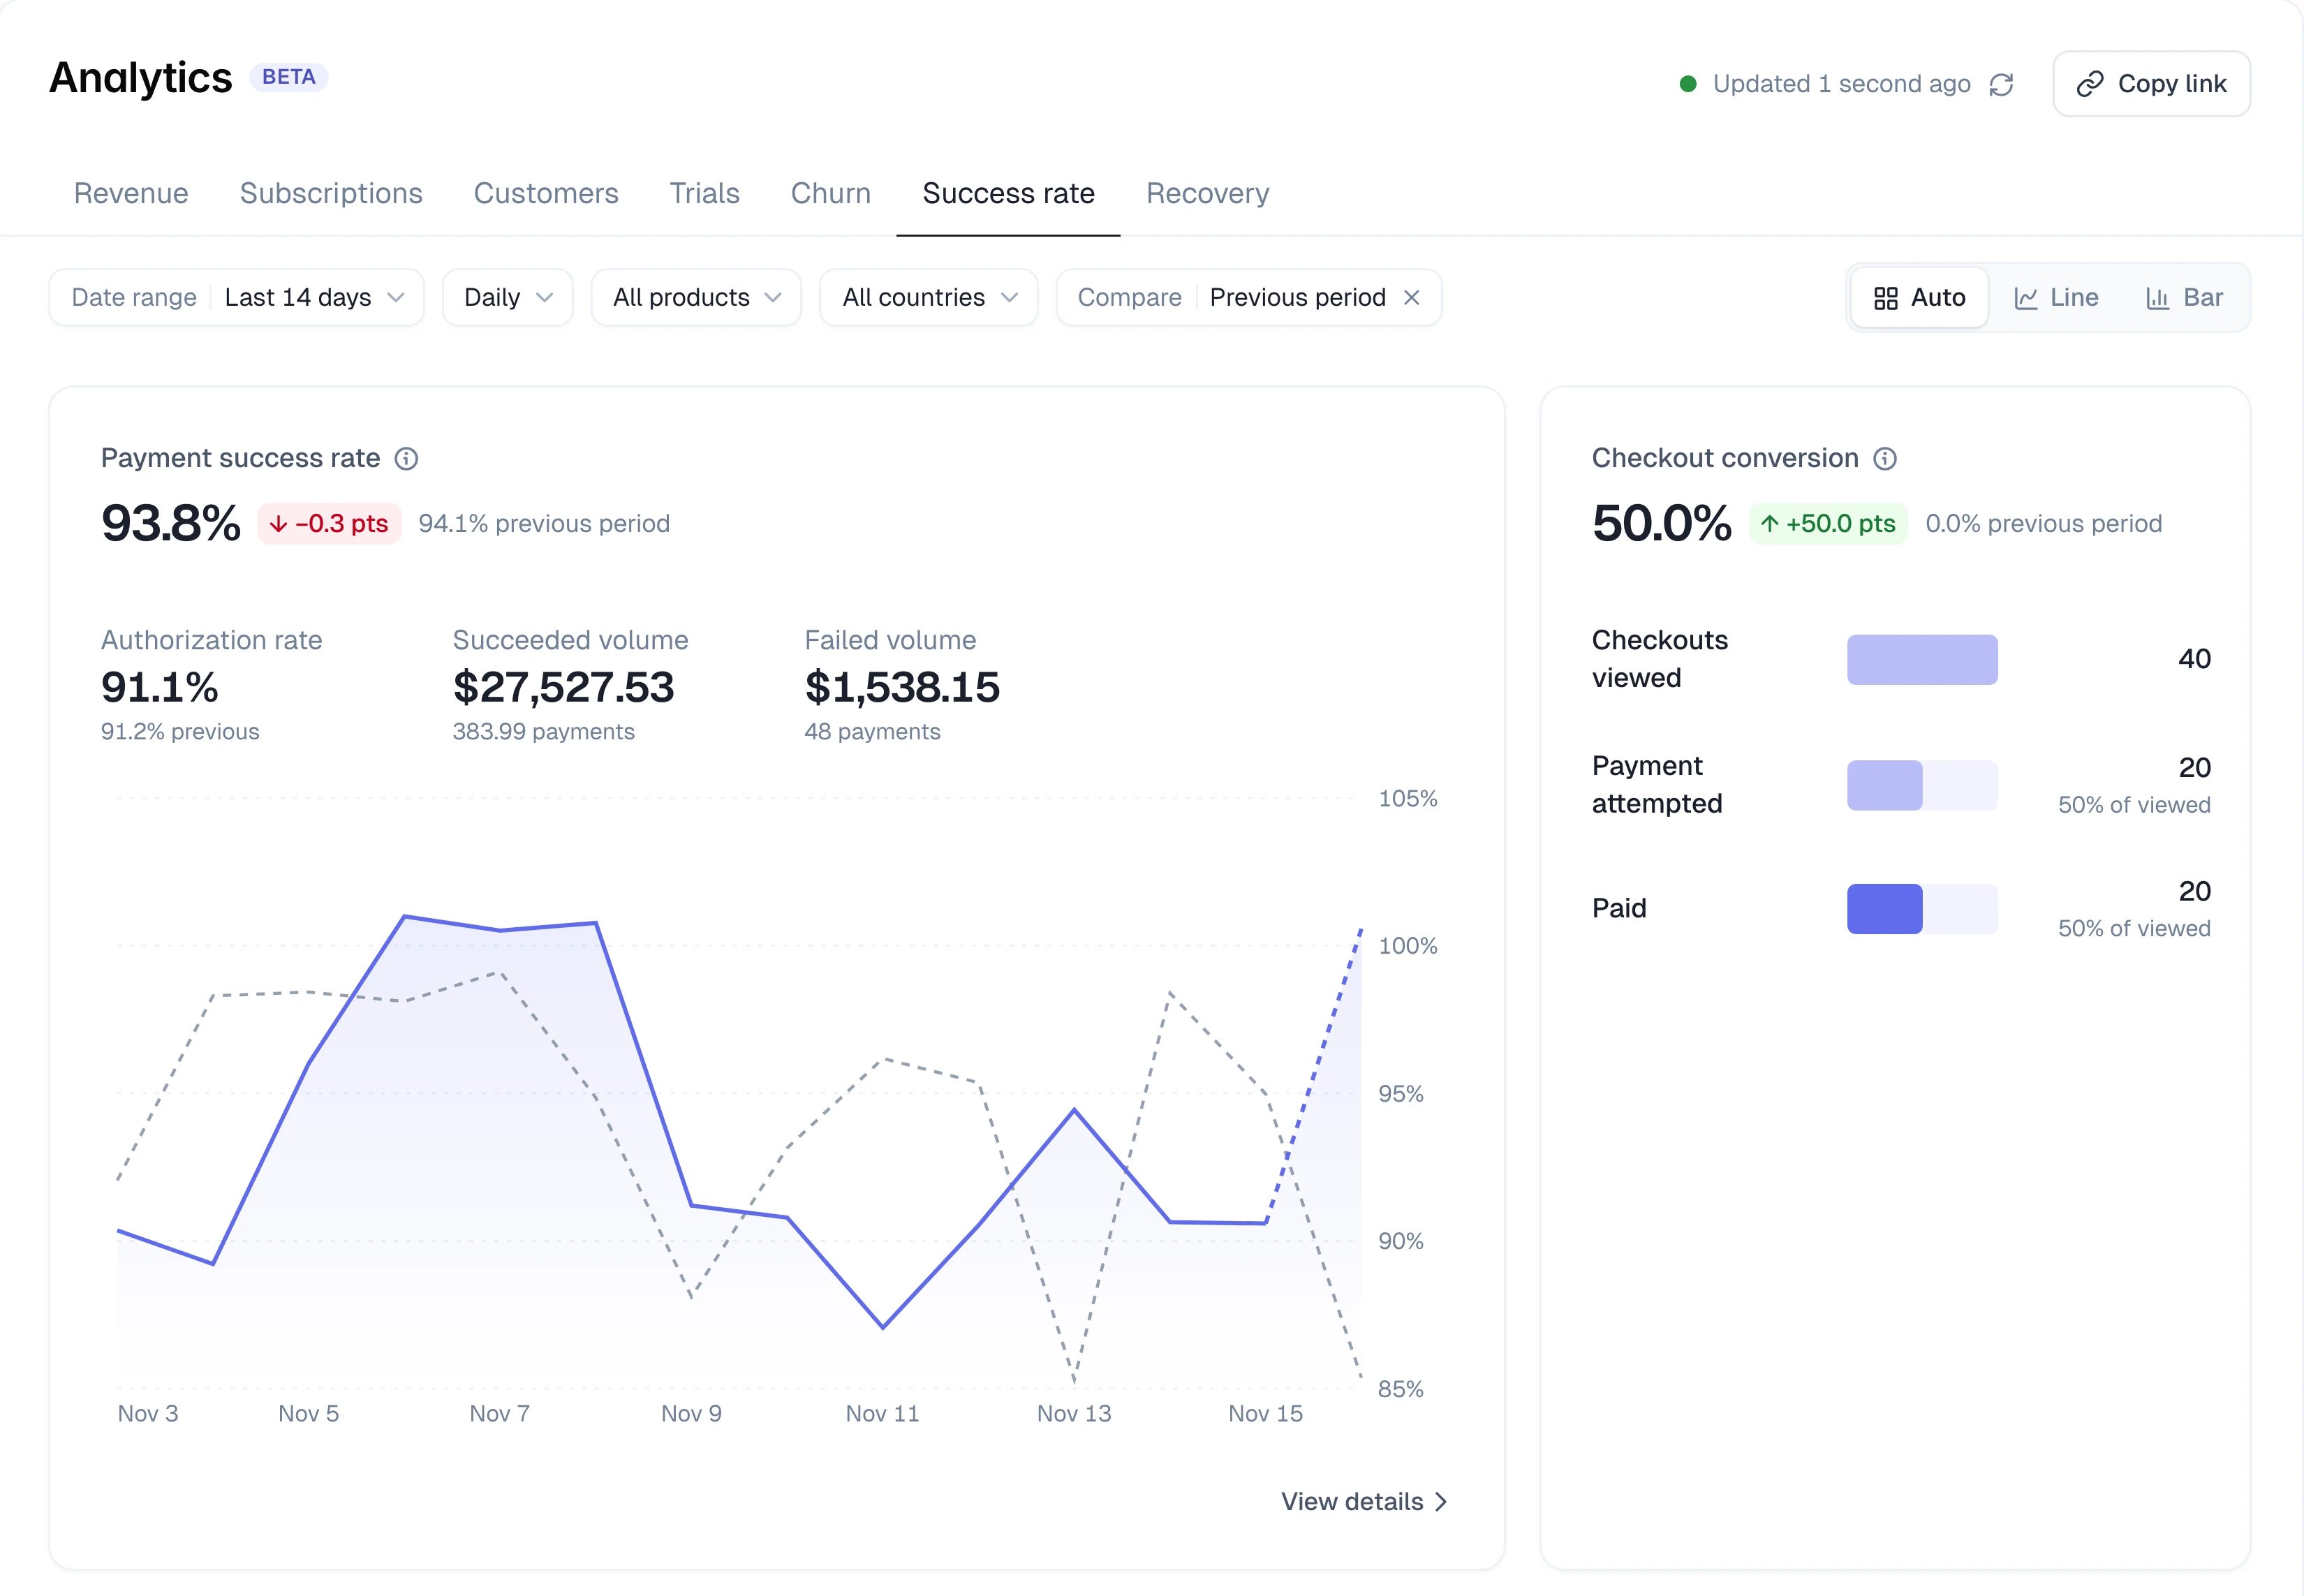
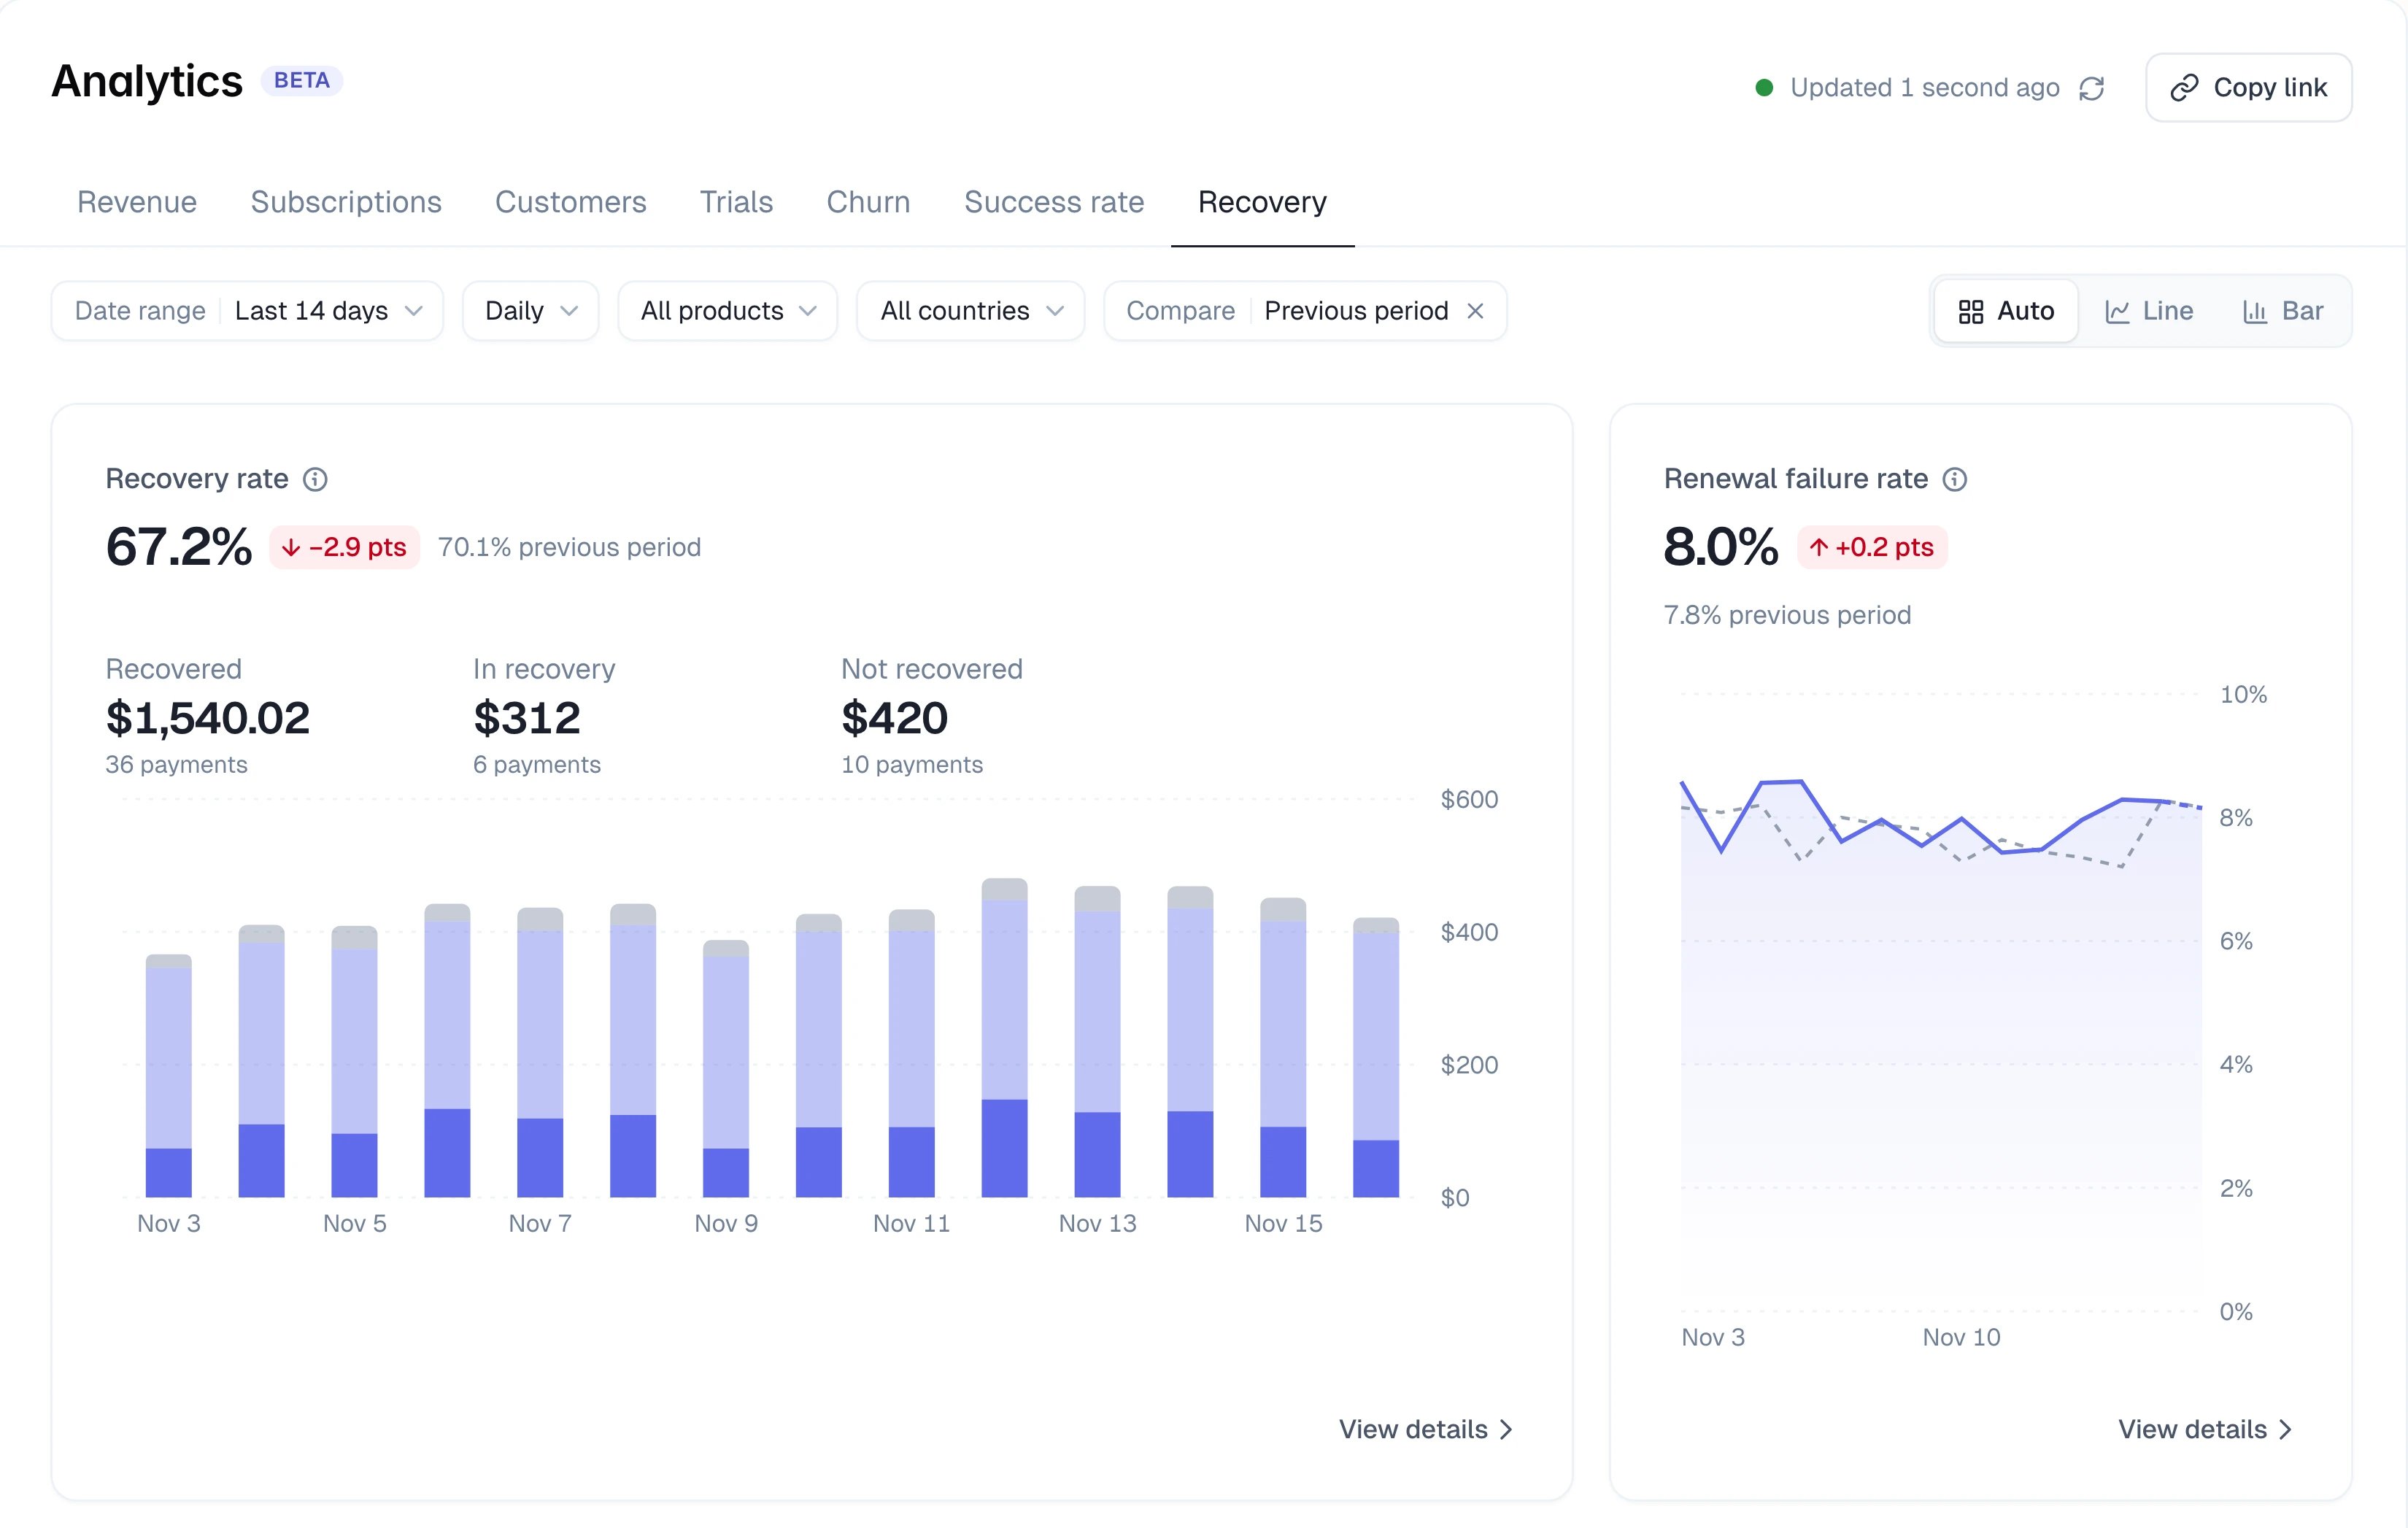
Each card shows the value for the selected range, the change against the previous period, and a chart. Click View details on a card to open the metric on its own, with a day-by-day table and a total under the chart.
- Revenue
- Subscriptions
- Customers
- Trials
- Churn
- Success rate
- Recovery
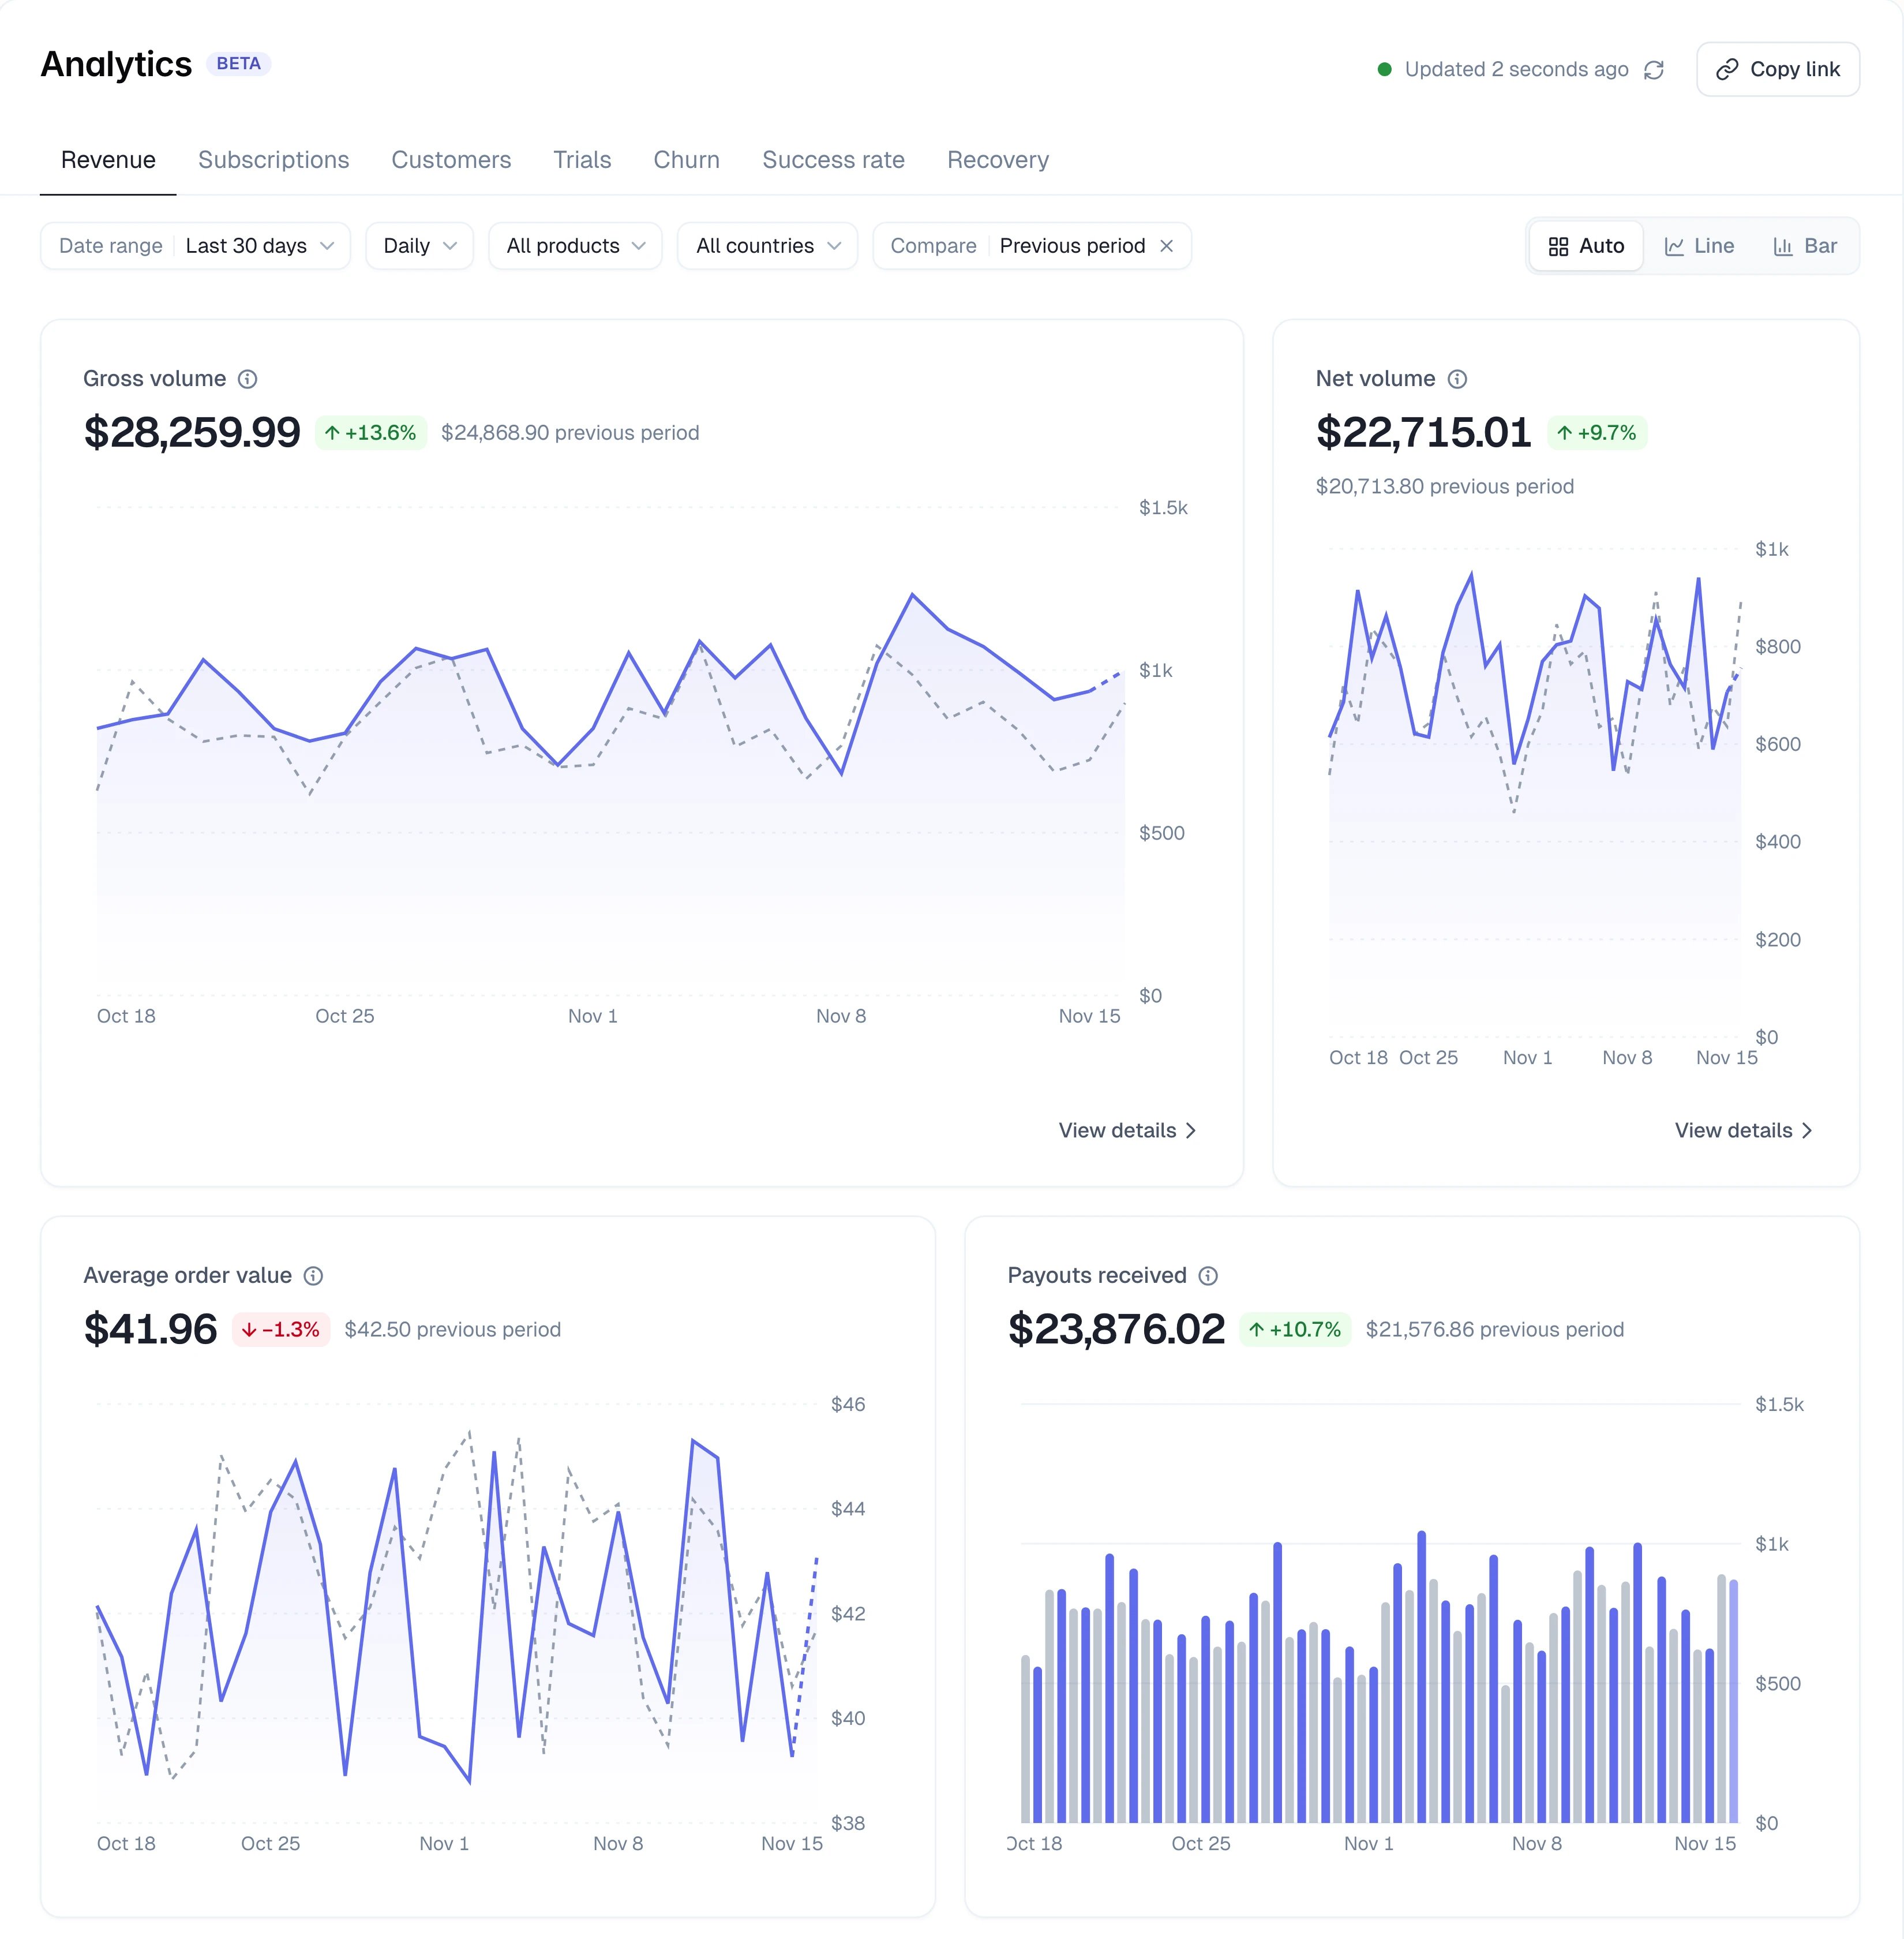
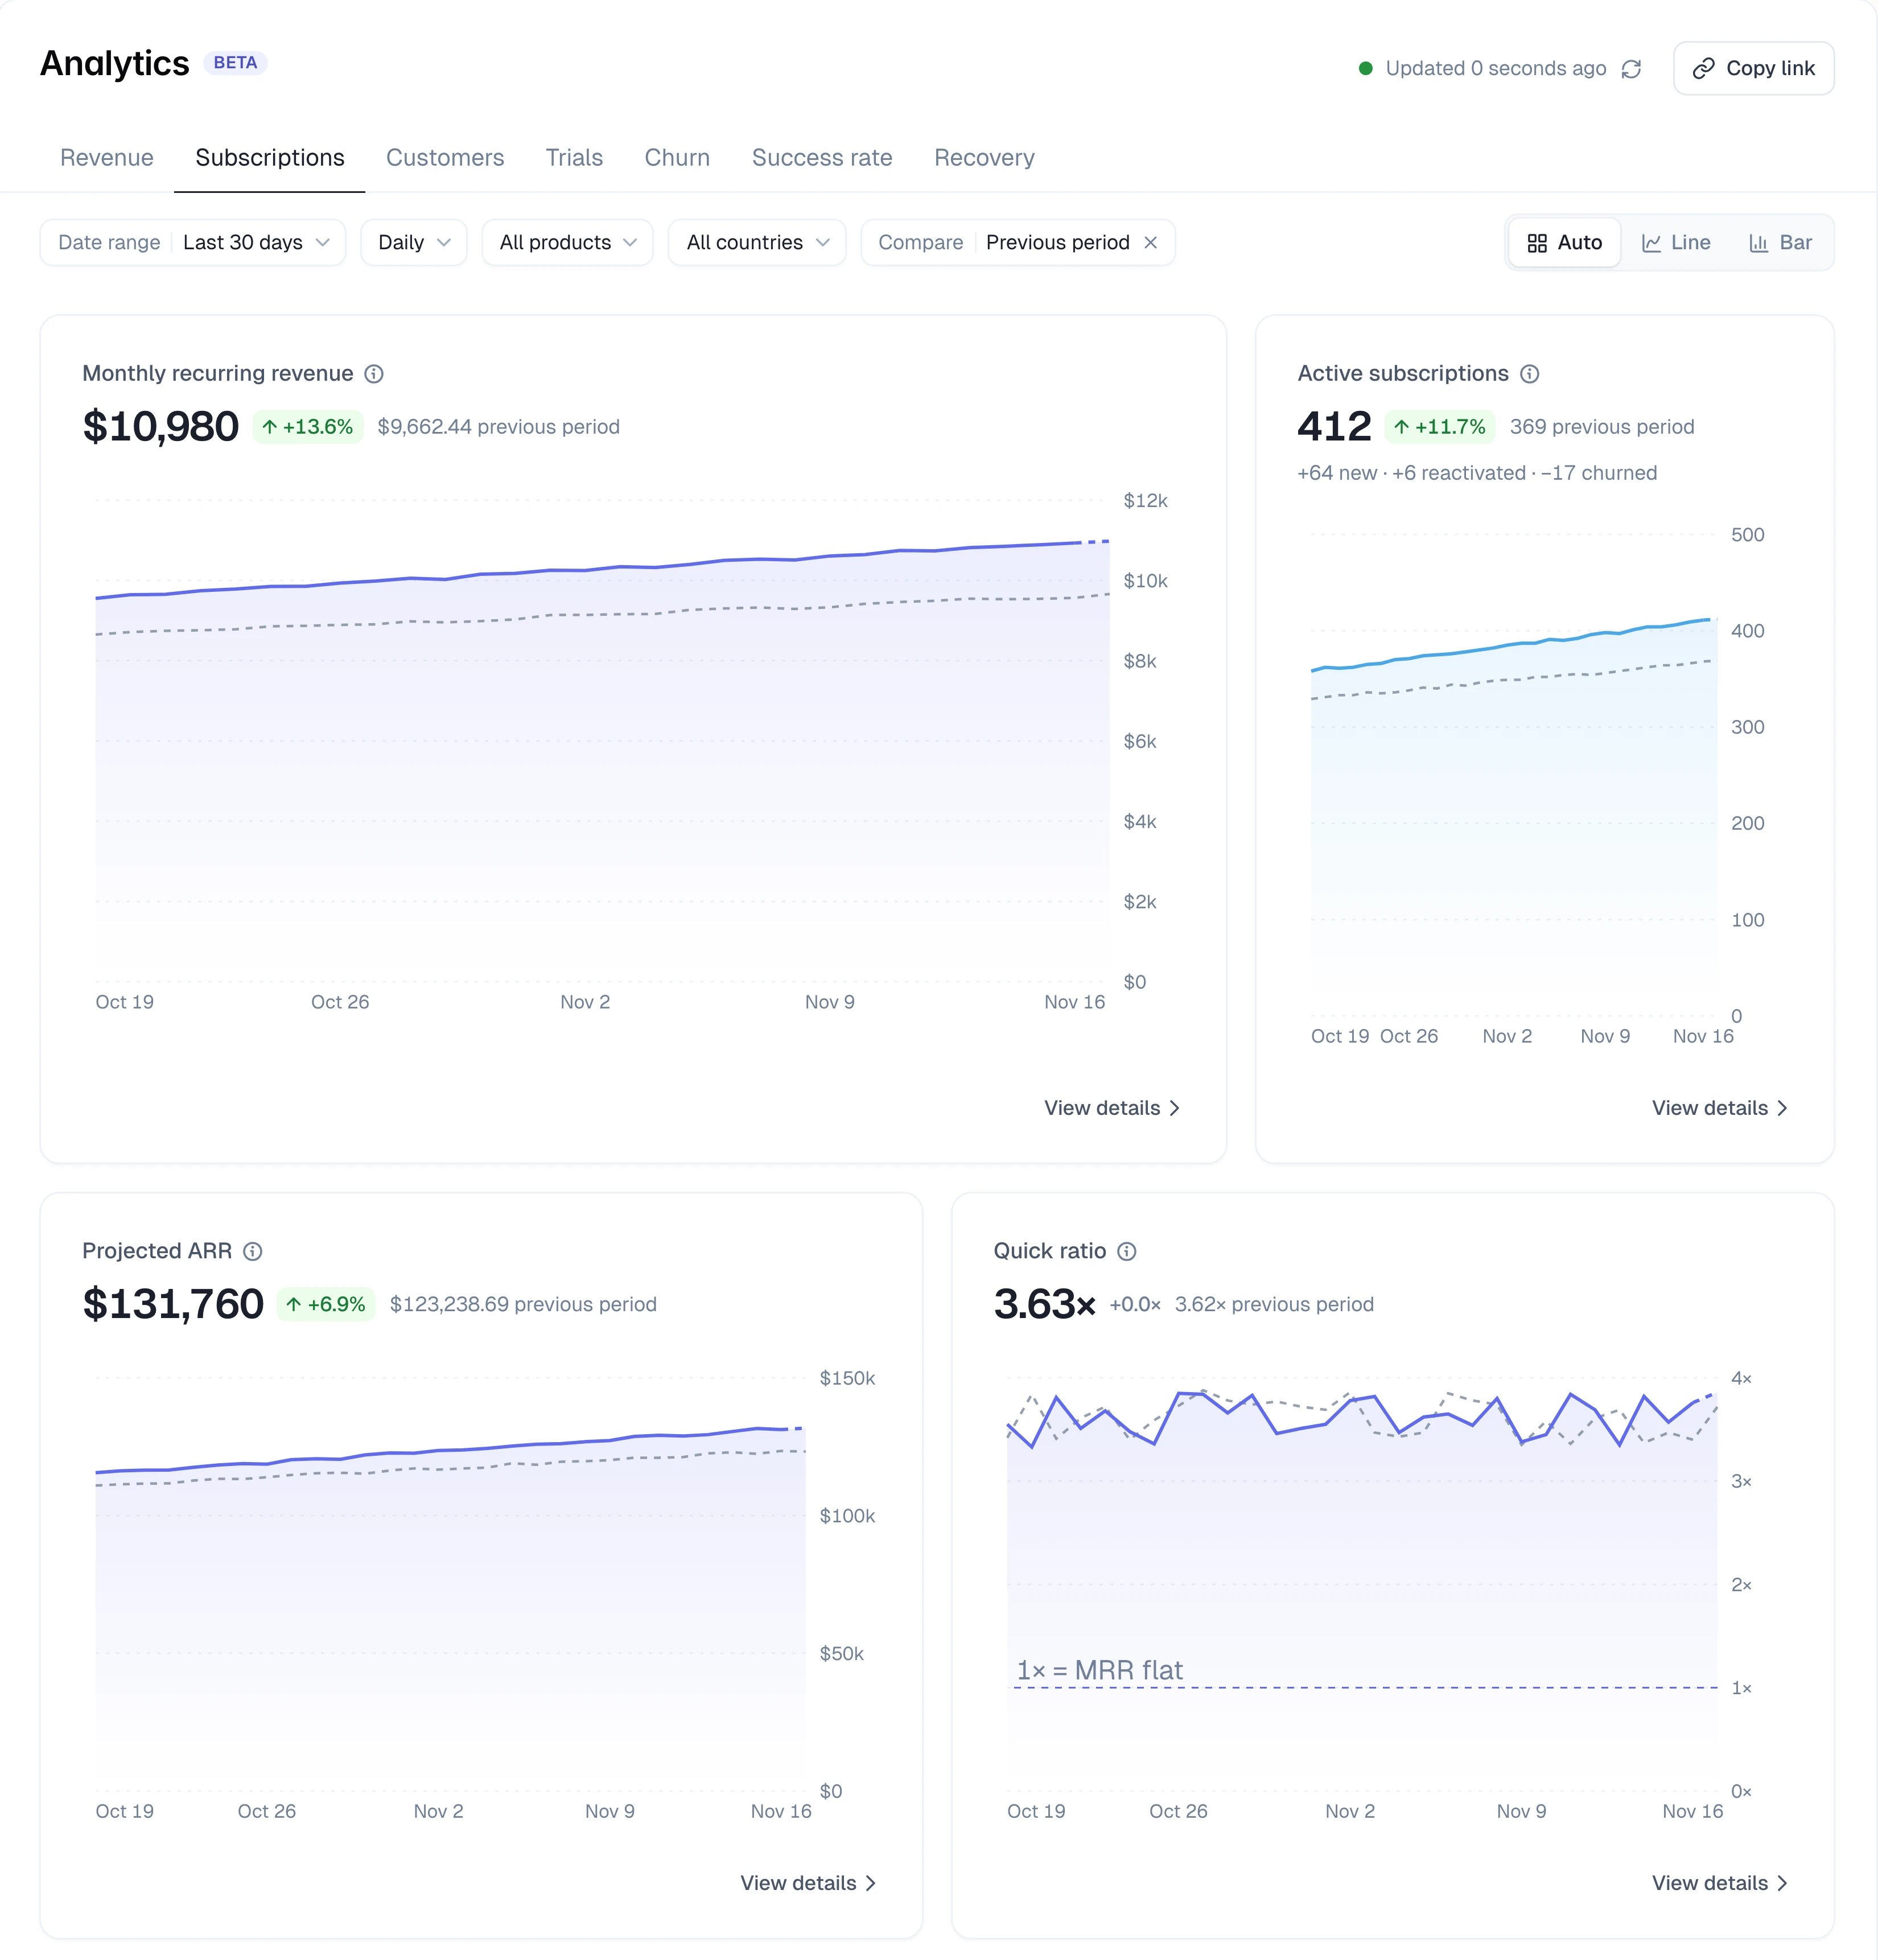
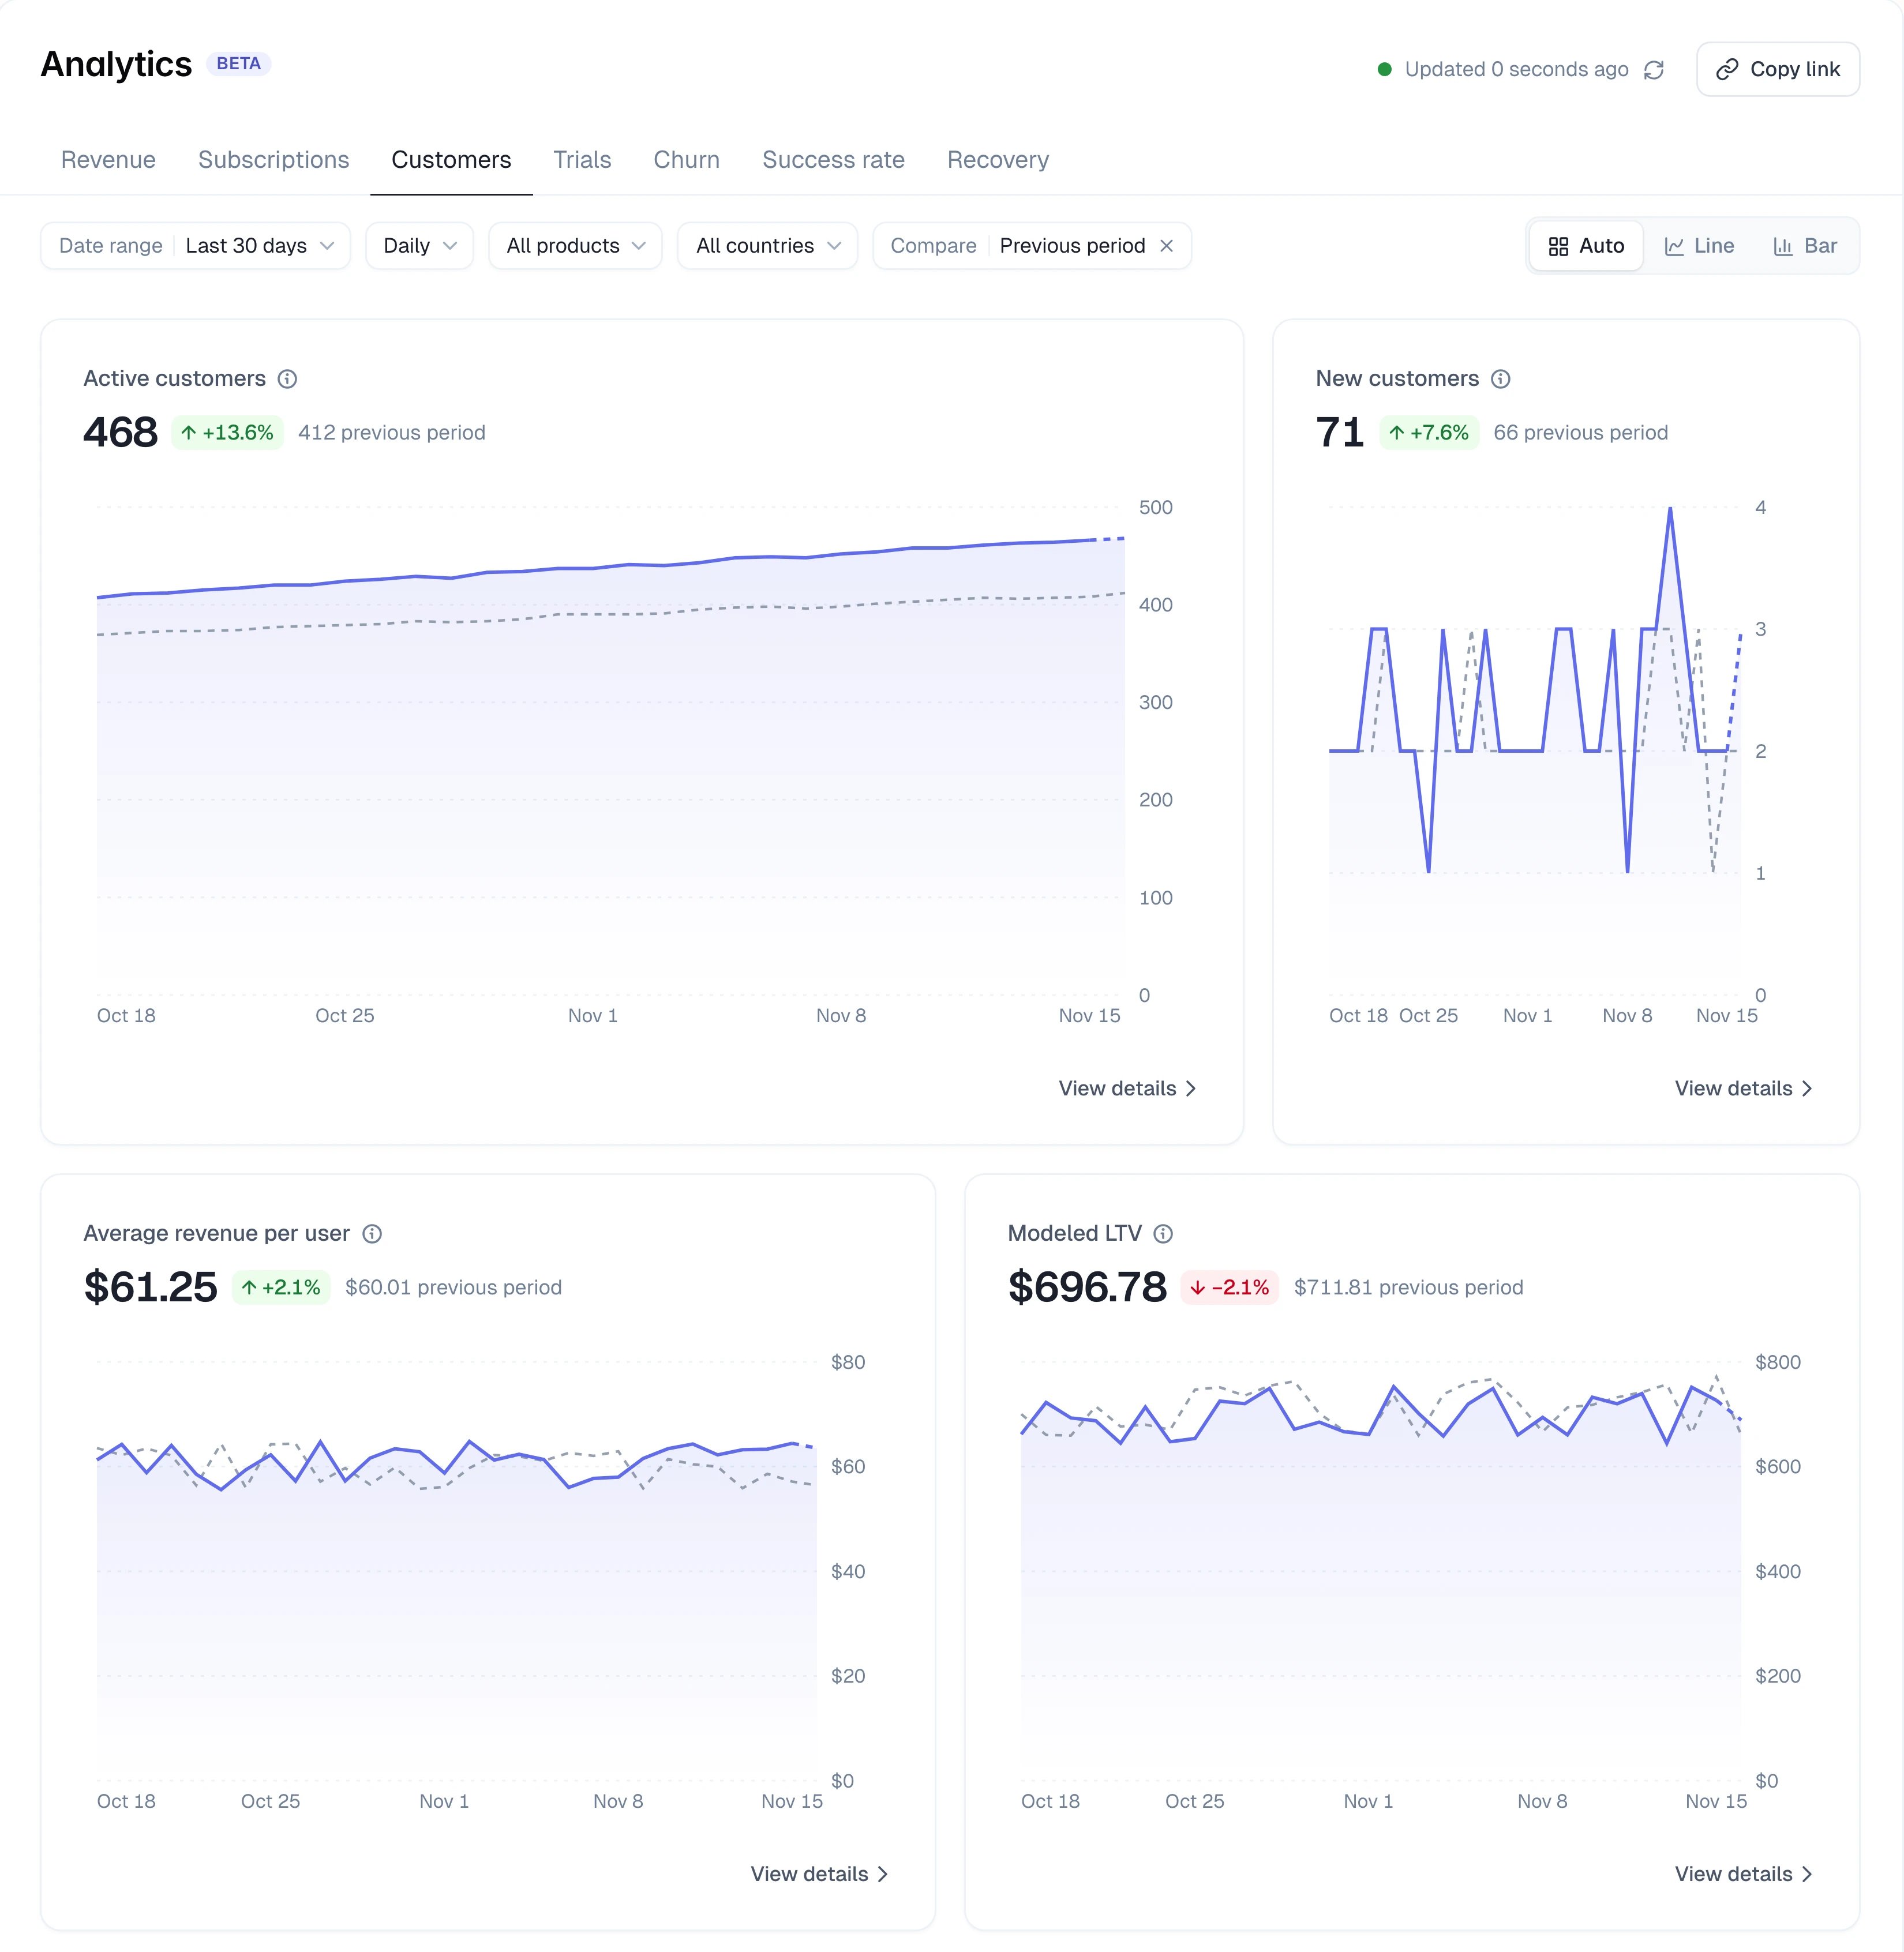
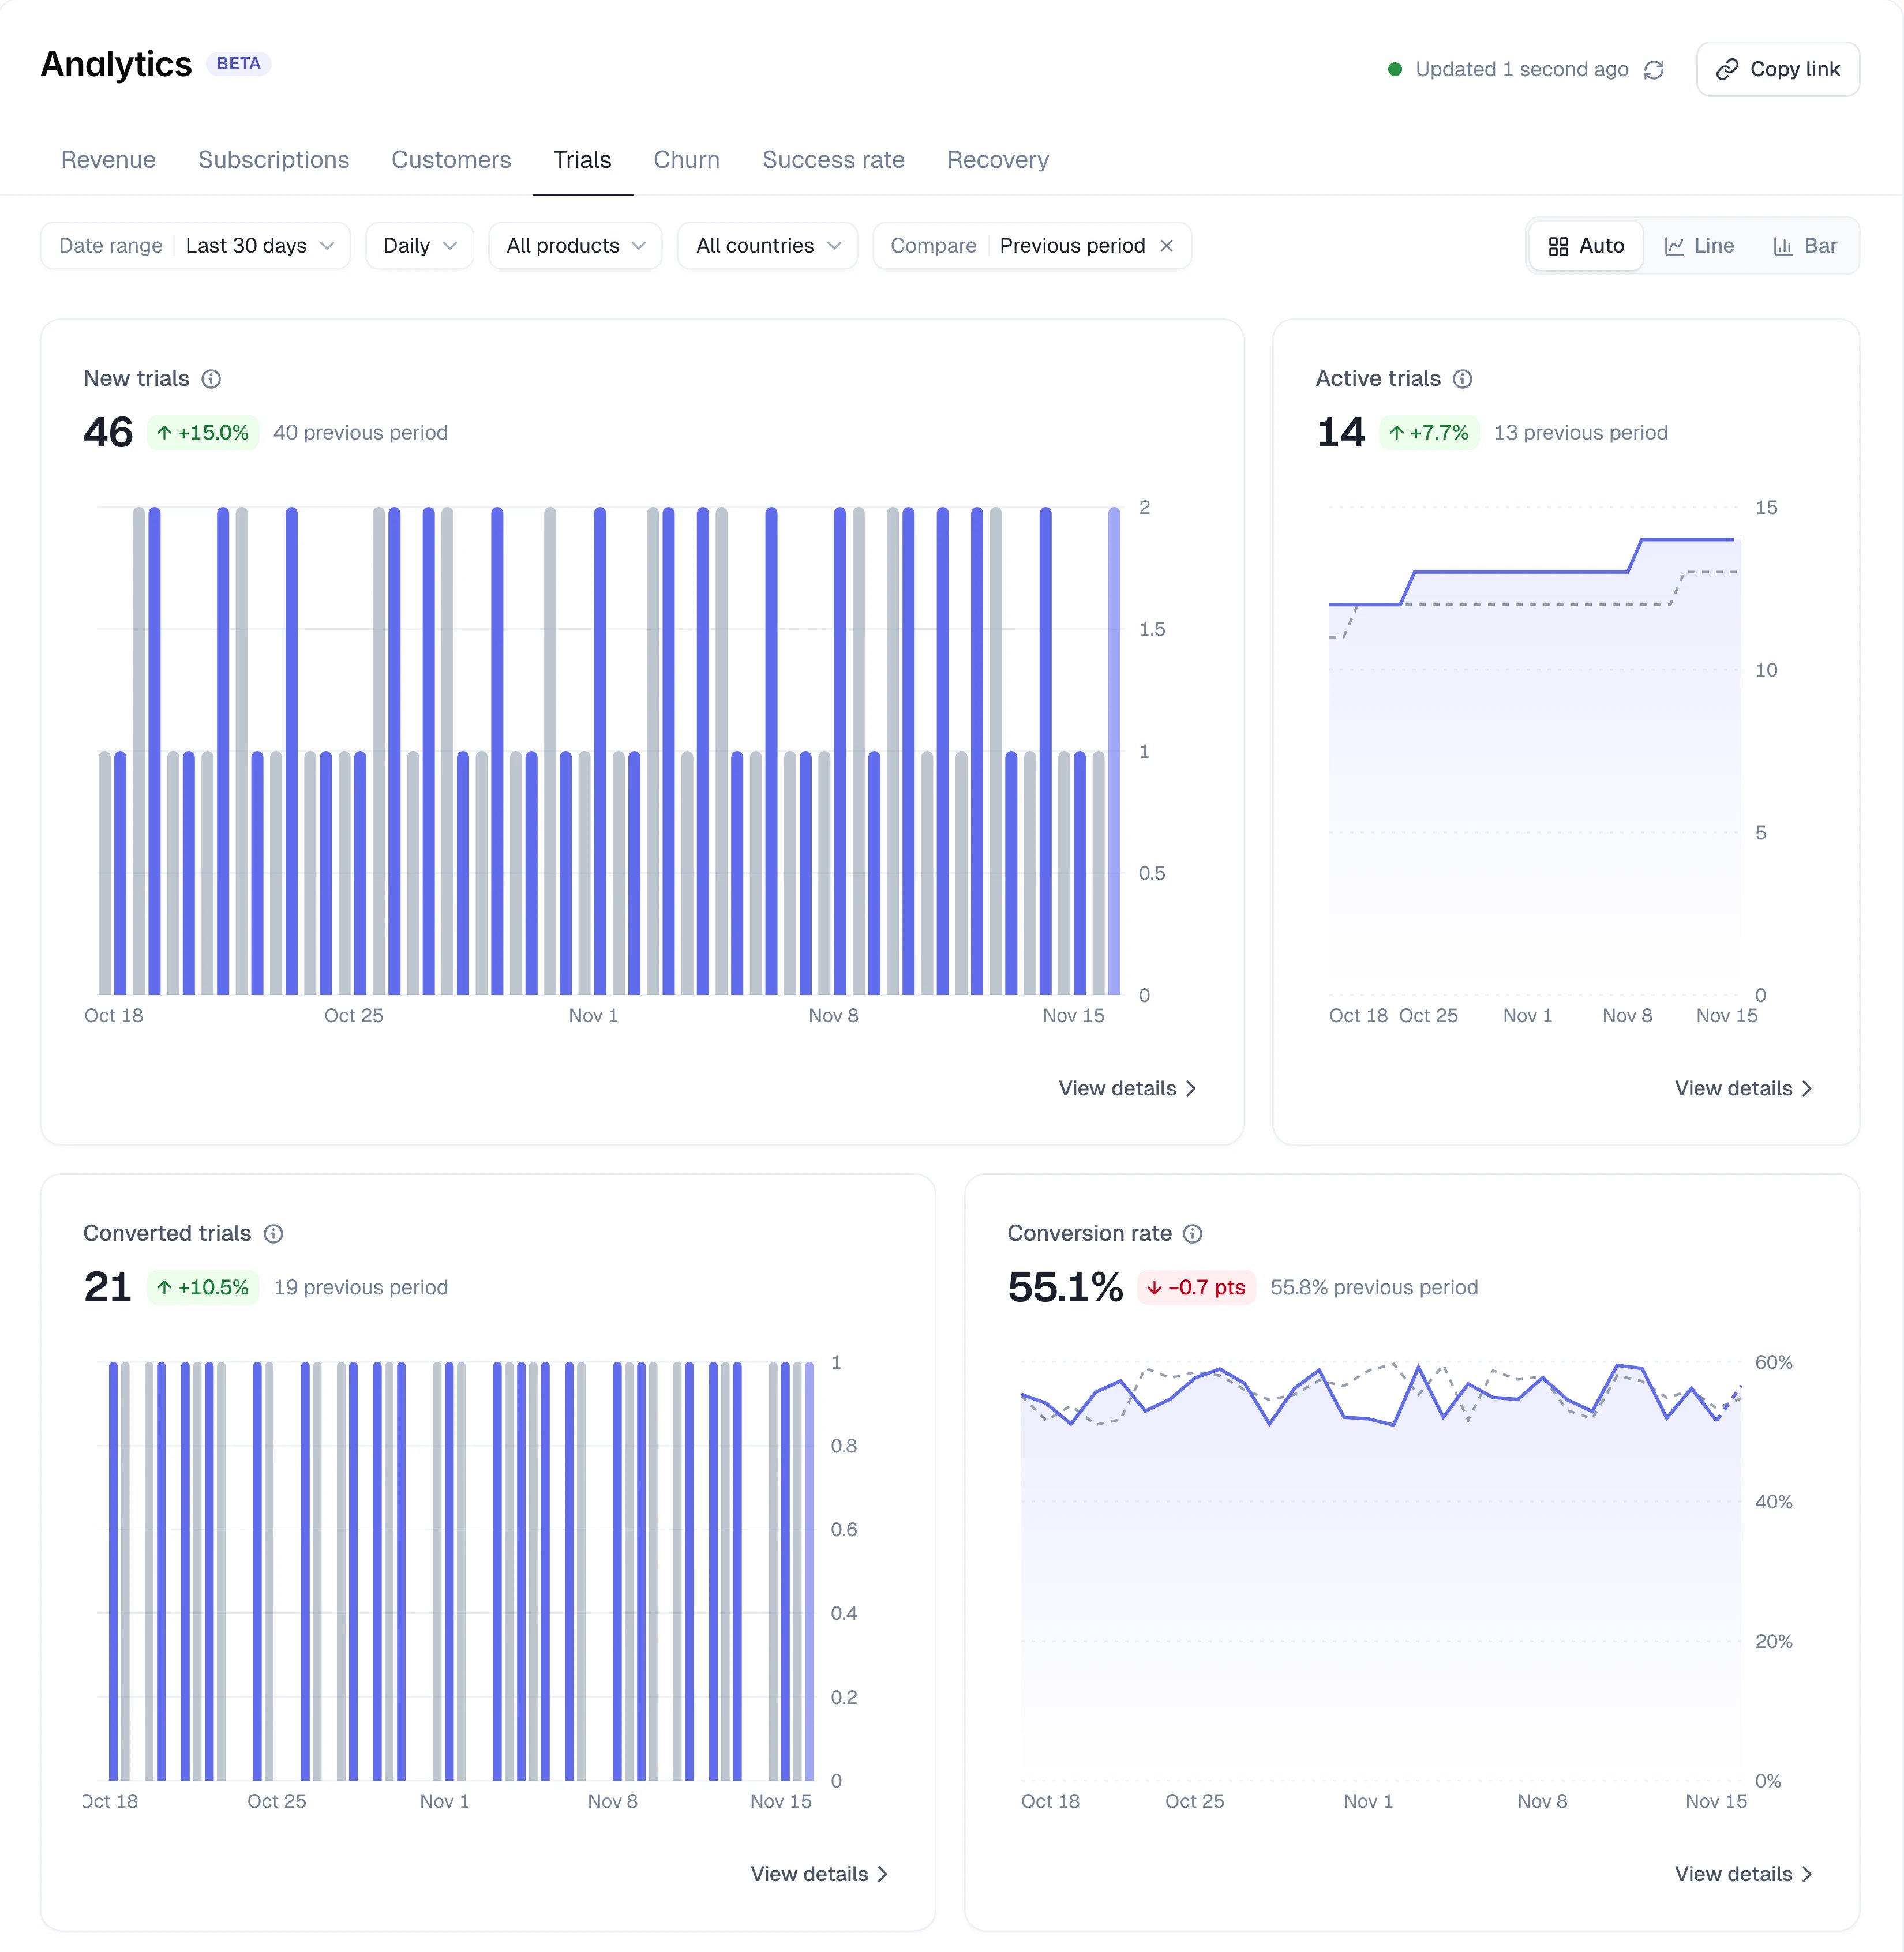
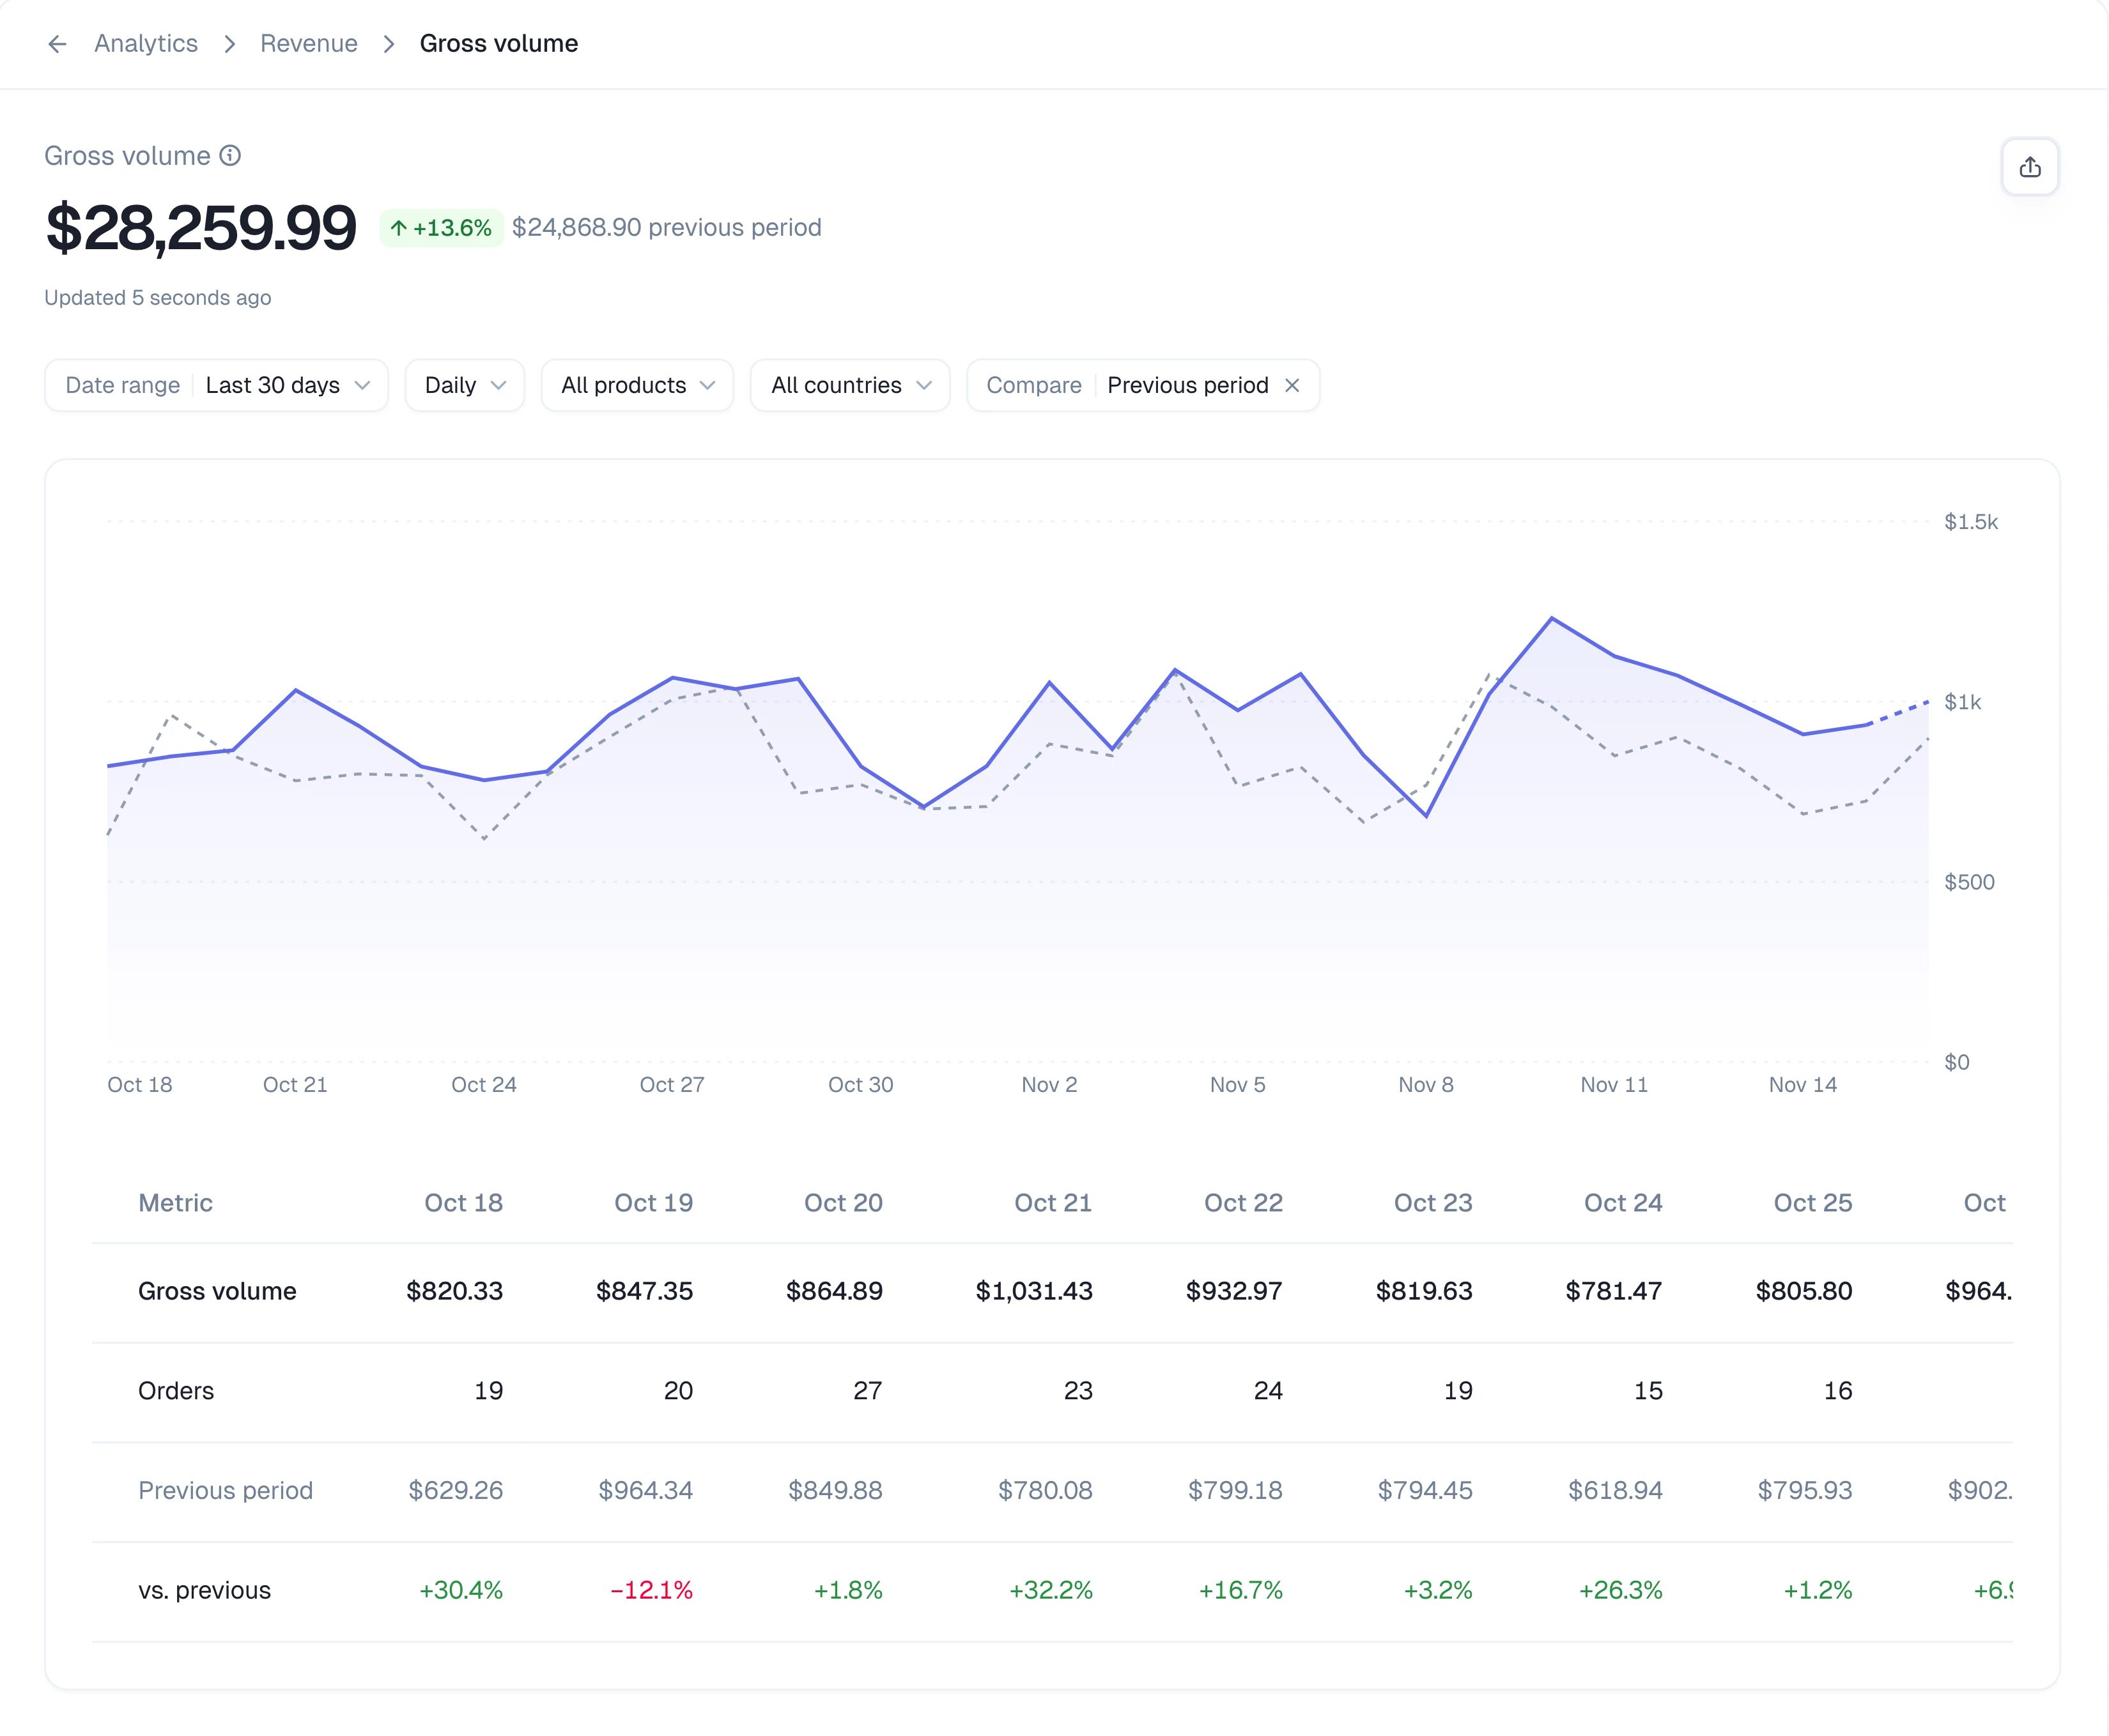
Gross volume
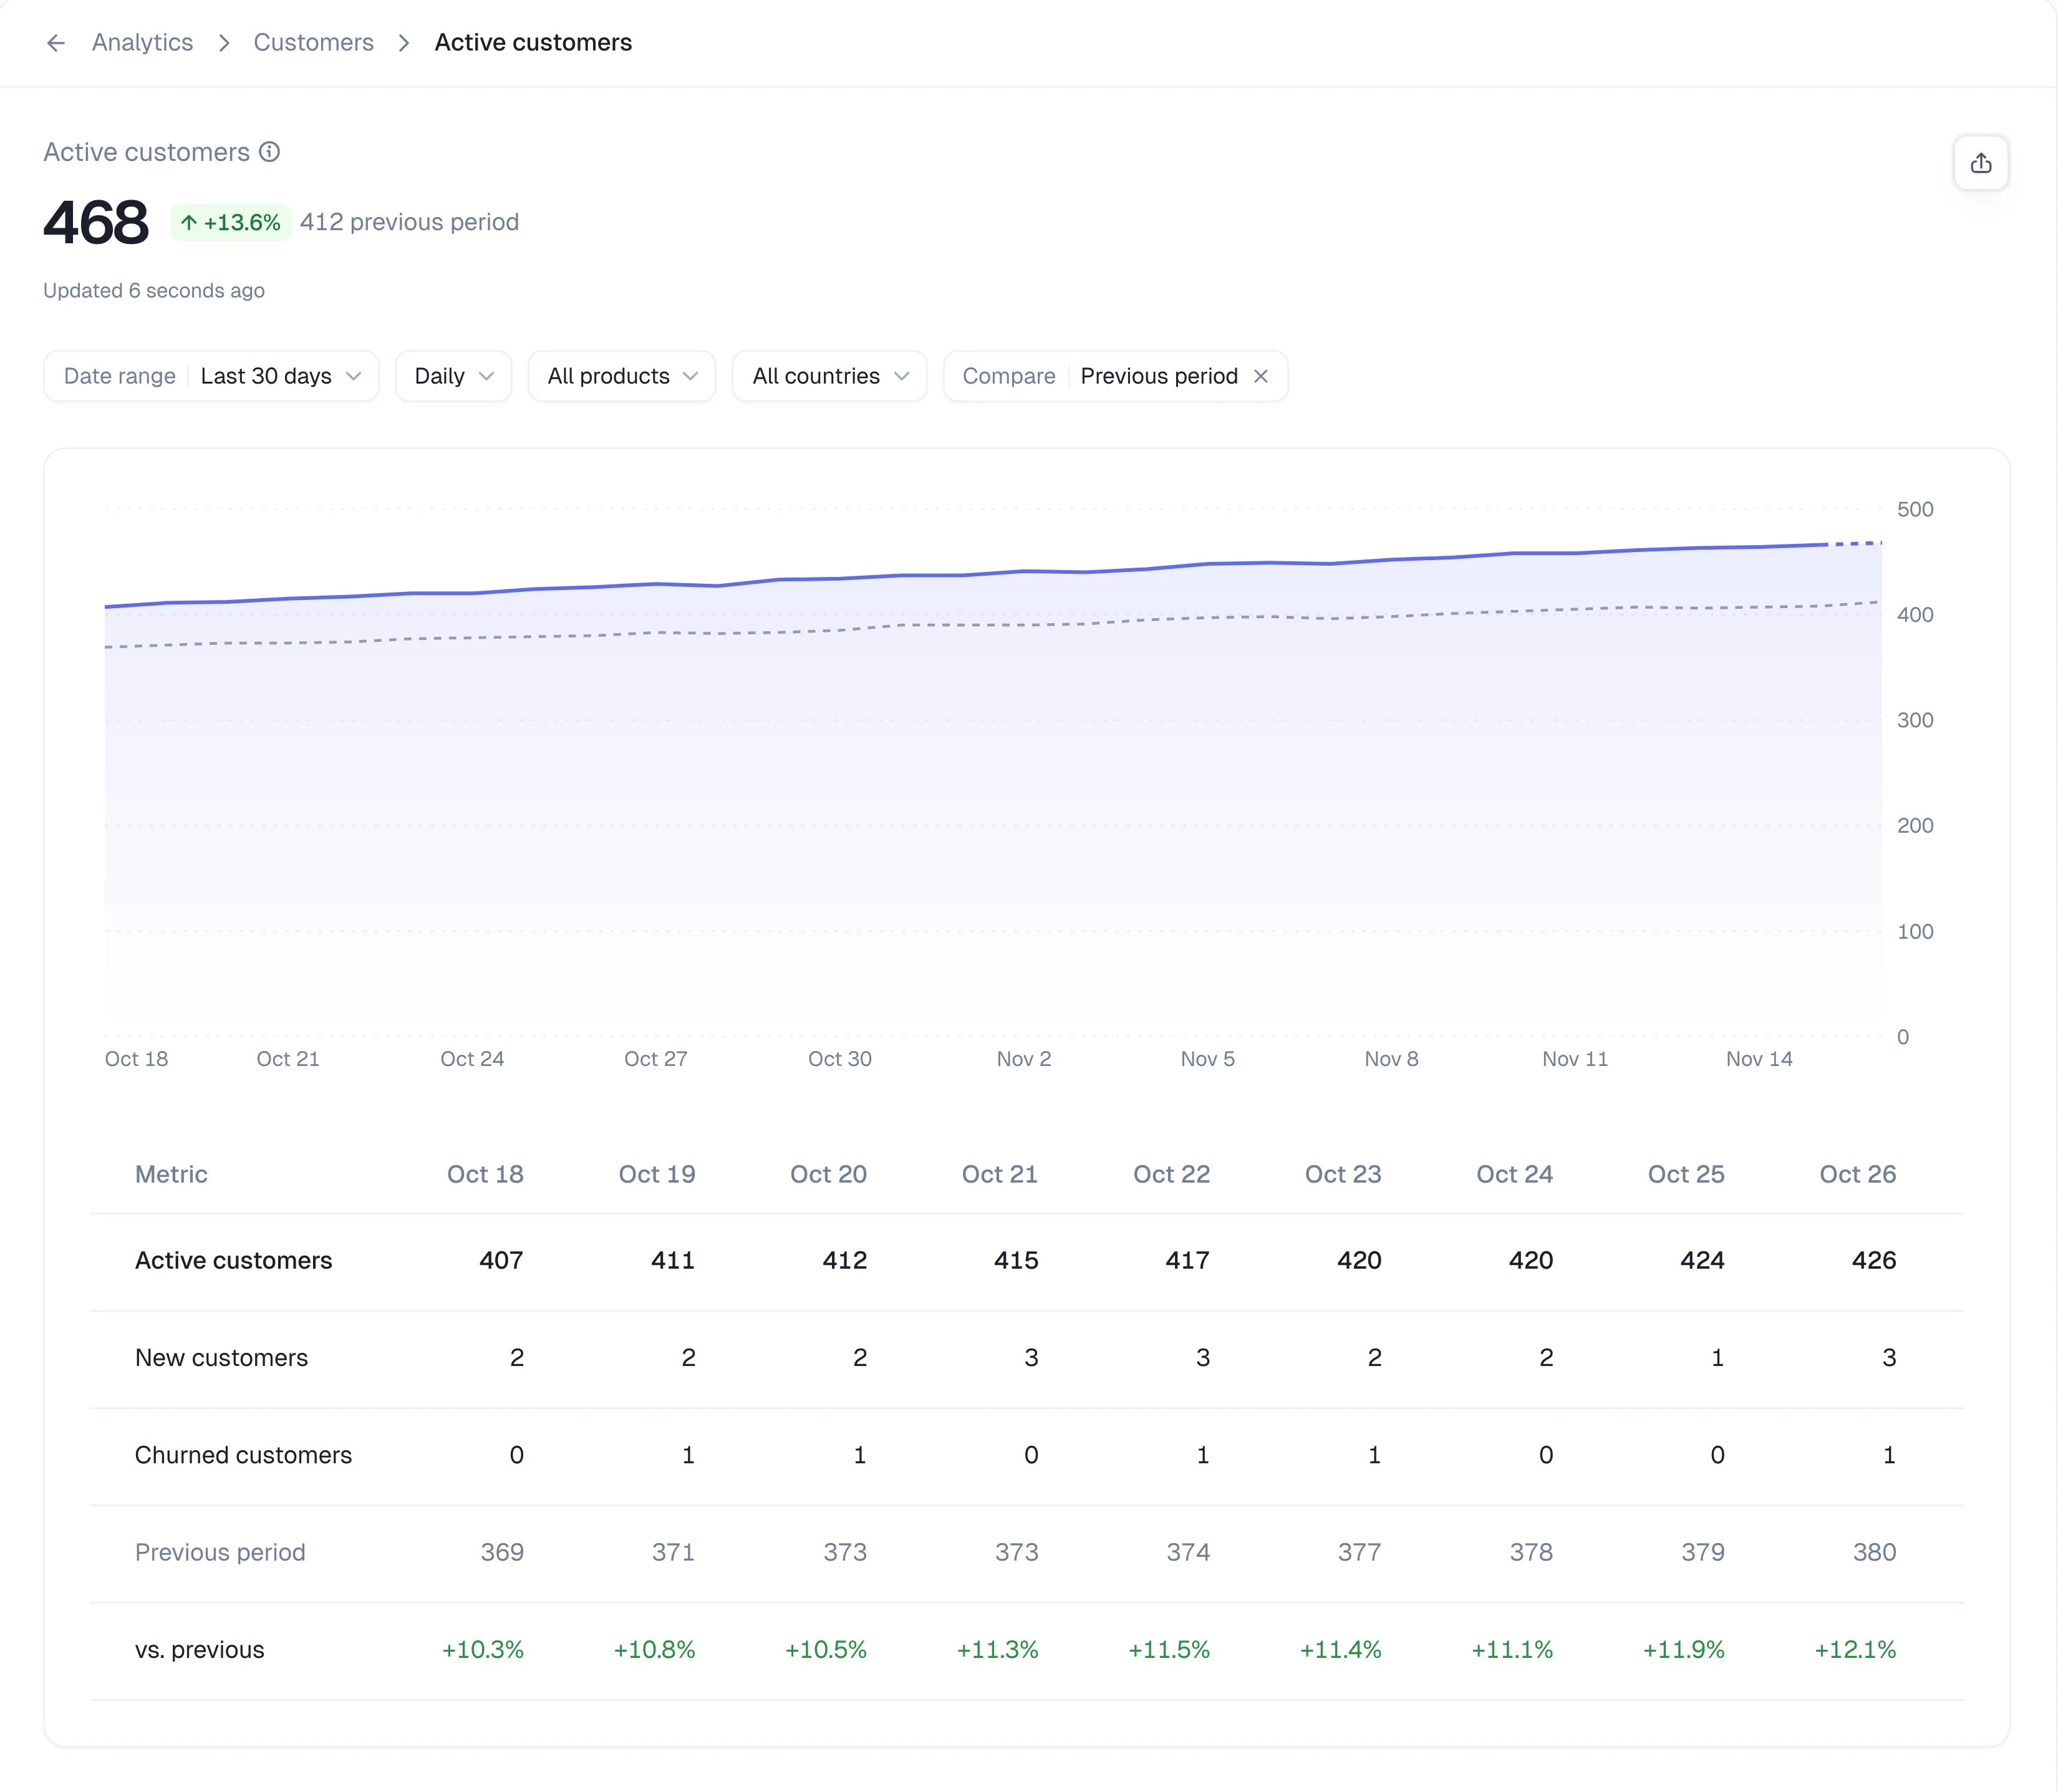
Active customers
What the numbers mean
The definitions below are the ones shown when you hover the info icon next to a card.Revenue
Subscriptions
Customers
Trials
Churn
Success rate
The Success rate and Recovery tabs open on the last 14 days by default. The other tabs open on the last 30 days.
Recovery
Kelviq retries failed renewals and emails the customer on its own. Subscriptions covers the schedule.
Filters
The filter bar at the top applies to every card on the tab:
Once a filter differs from the default, Reset appears next to the chips and puts everything back. On the right, Auto, Line and Bar switch the chart type for the whole tab.
Updated … ago at the top says when the numbers were last loaded. The icon next to it reloads them.
Copy a link with your filters
Click Copy link at the top right. The URL you get carries the tab and the filters you have set, so whoever opens it sees the same view, as long as they are a member of your organization. Use it to pin a view in a Slack channel or a weekly doc instead of describing the filters each time.Share a milestone
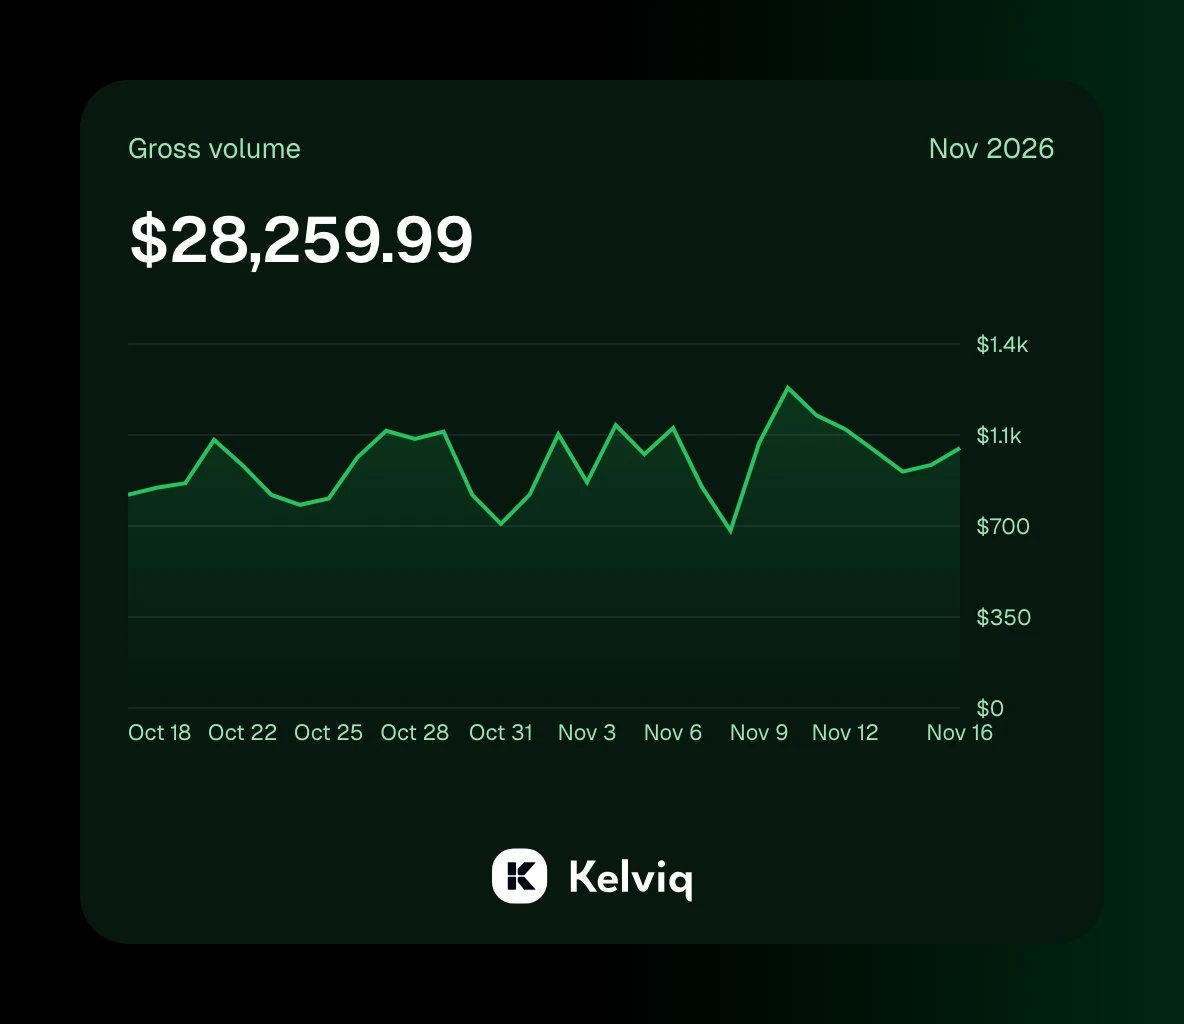
Any card can become an image to post. Hover the card and click the share icon, or open View details and click it there. The Share milestone dialog shows the chart on a card with the metric name, the month, the value and the Kelviq logo. Pick one of eight themes (Mint, Sky, Midnight, Sunset, Forest, Ember, Pastel or Crimson) and a bar or line chart, then Copy image or Download image.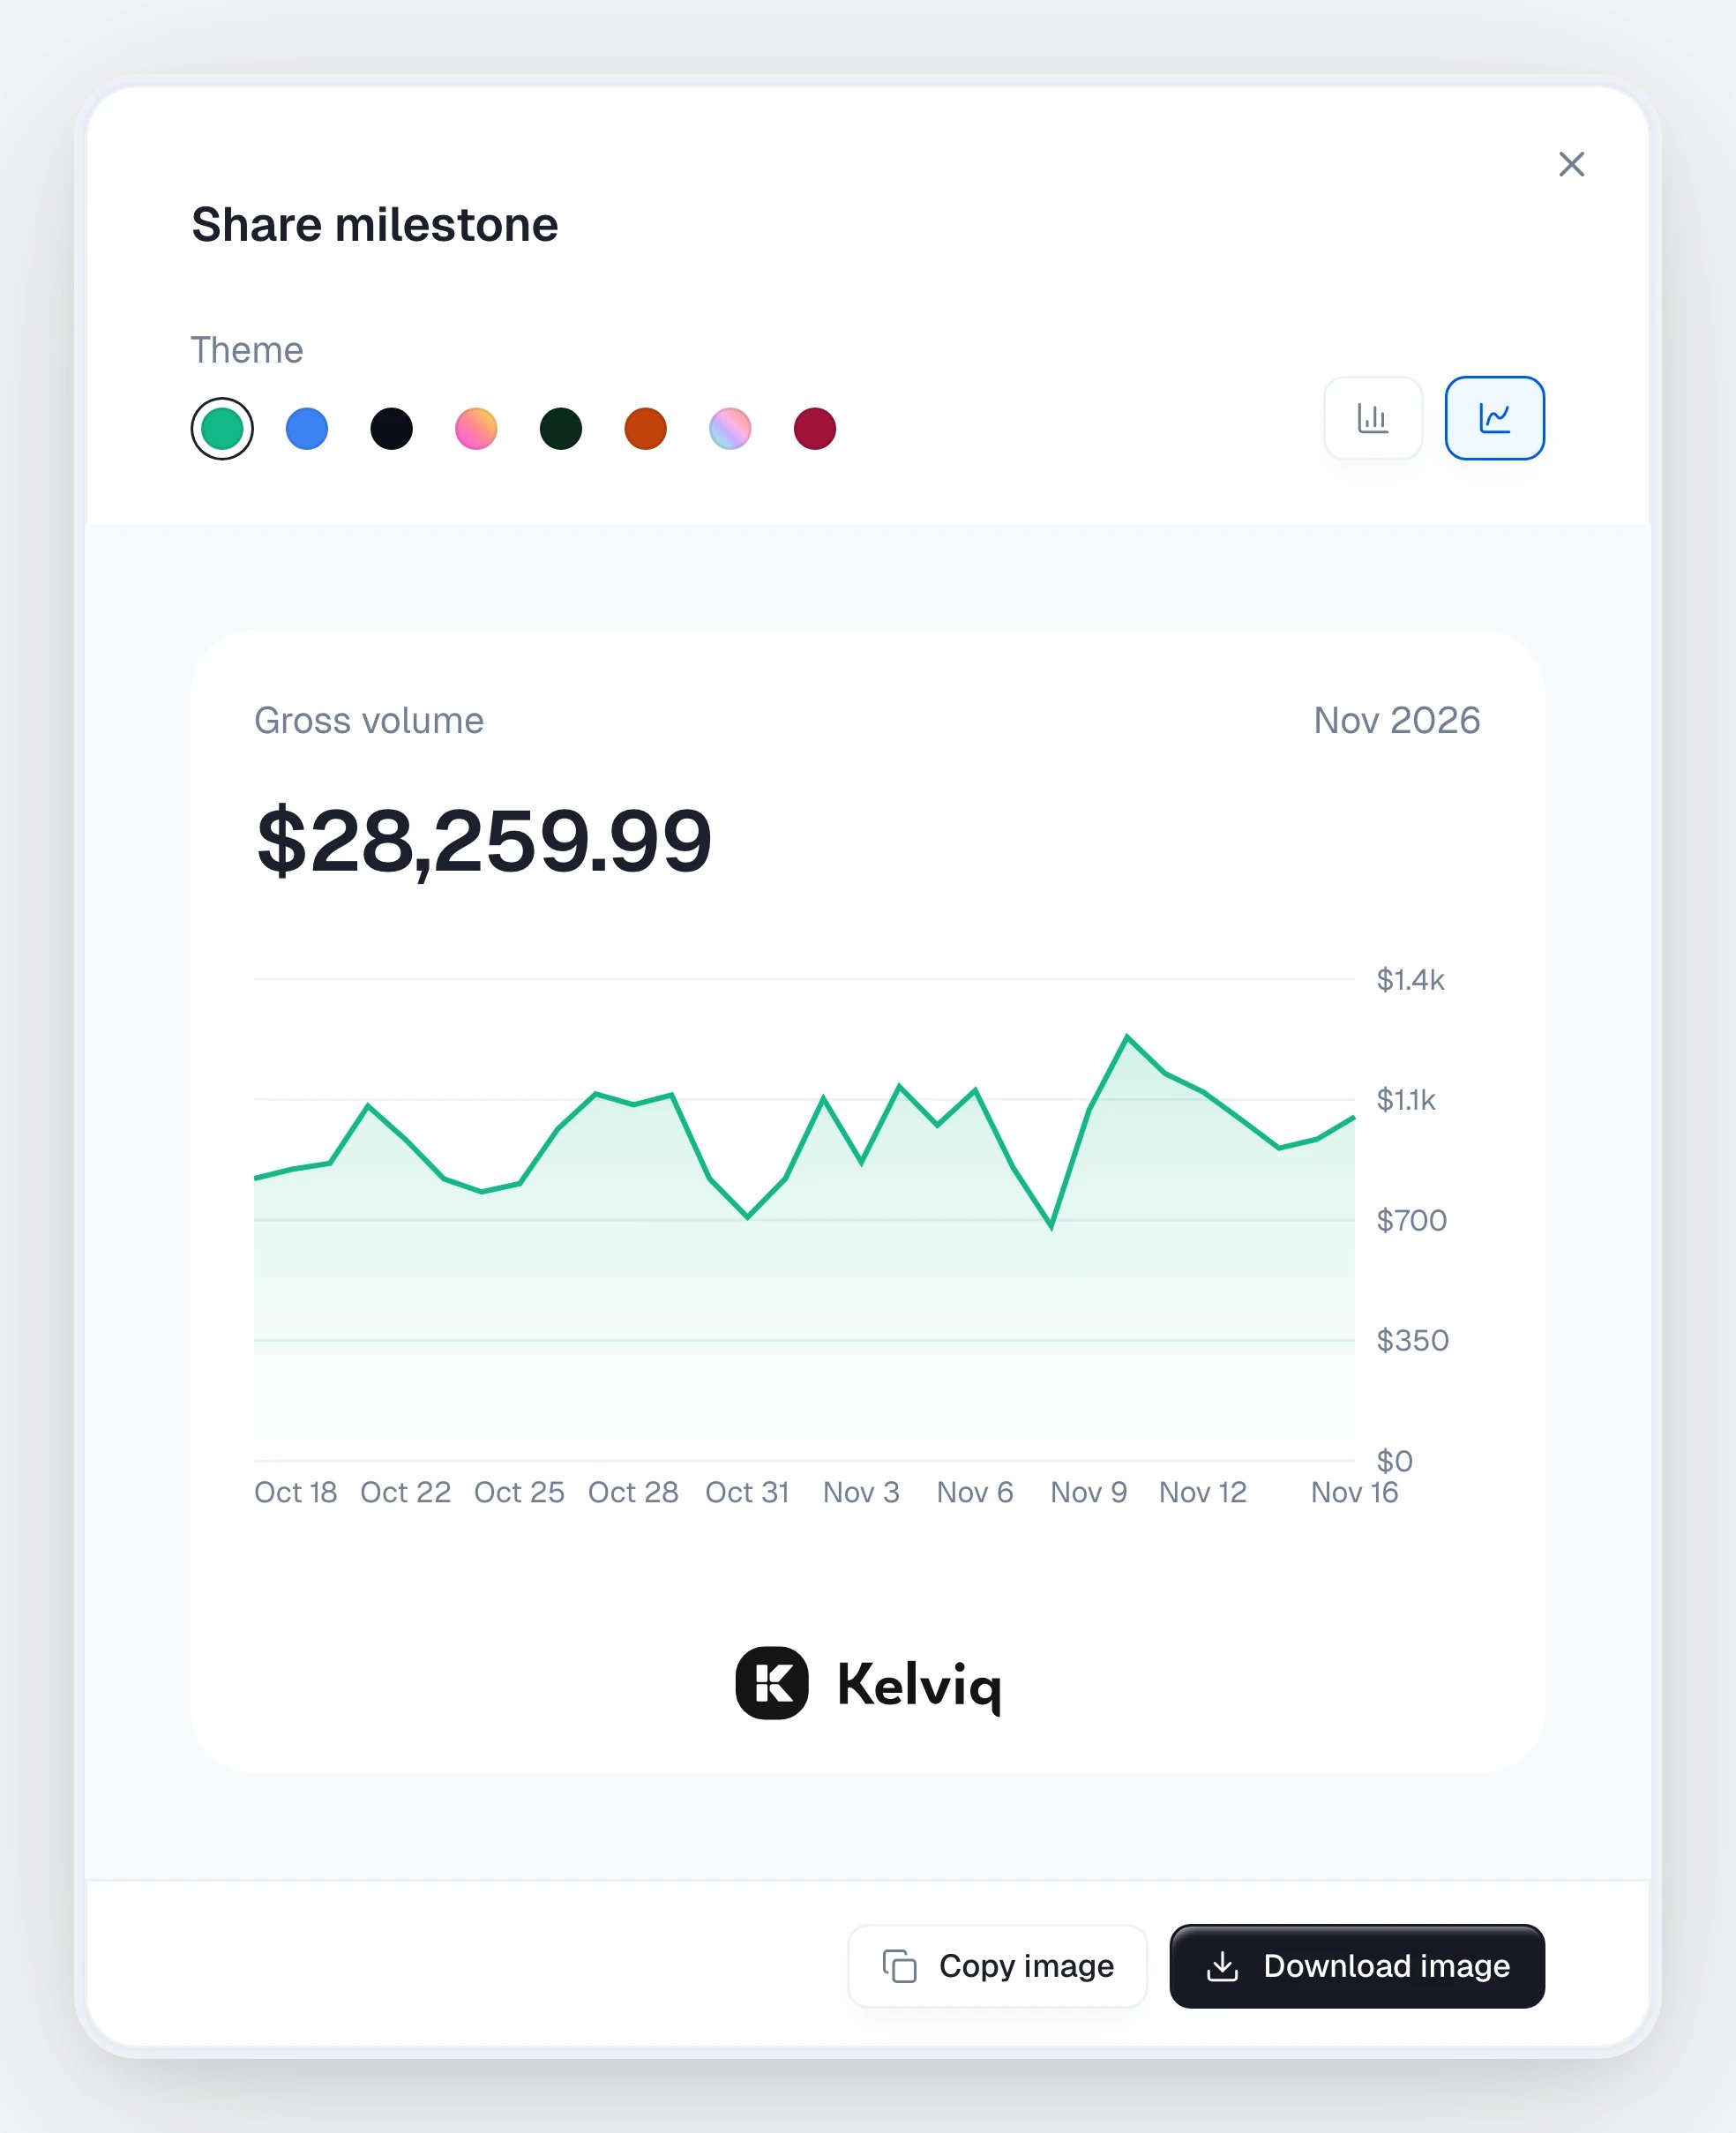
Mint theme, line chart
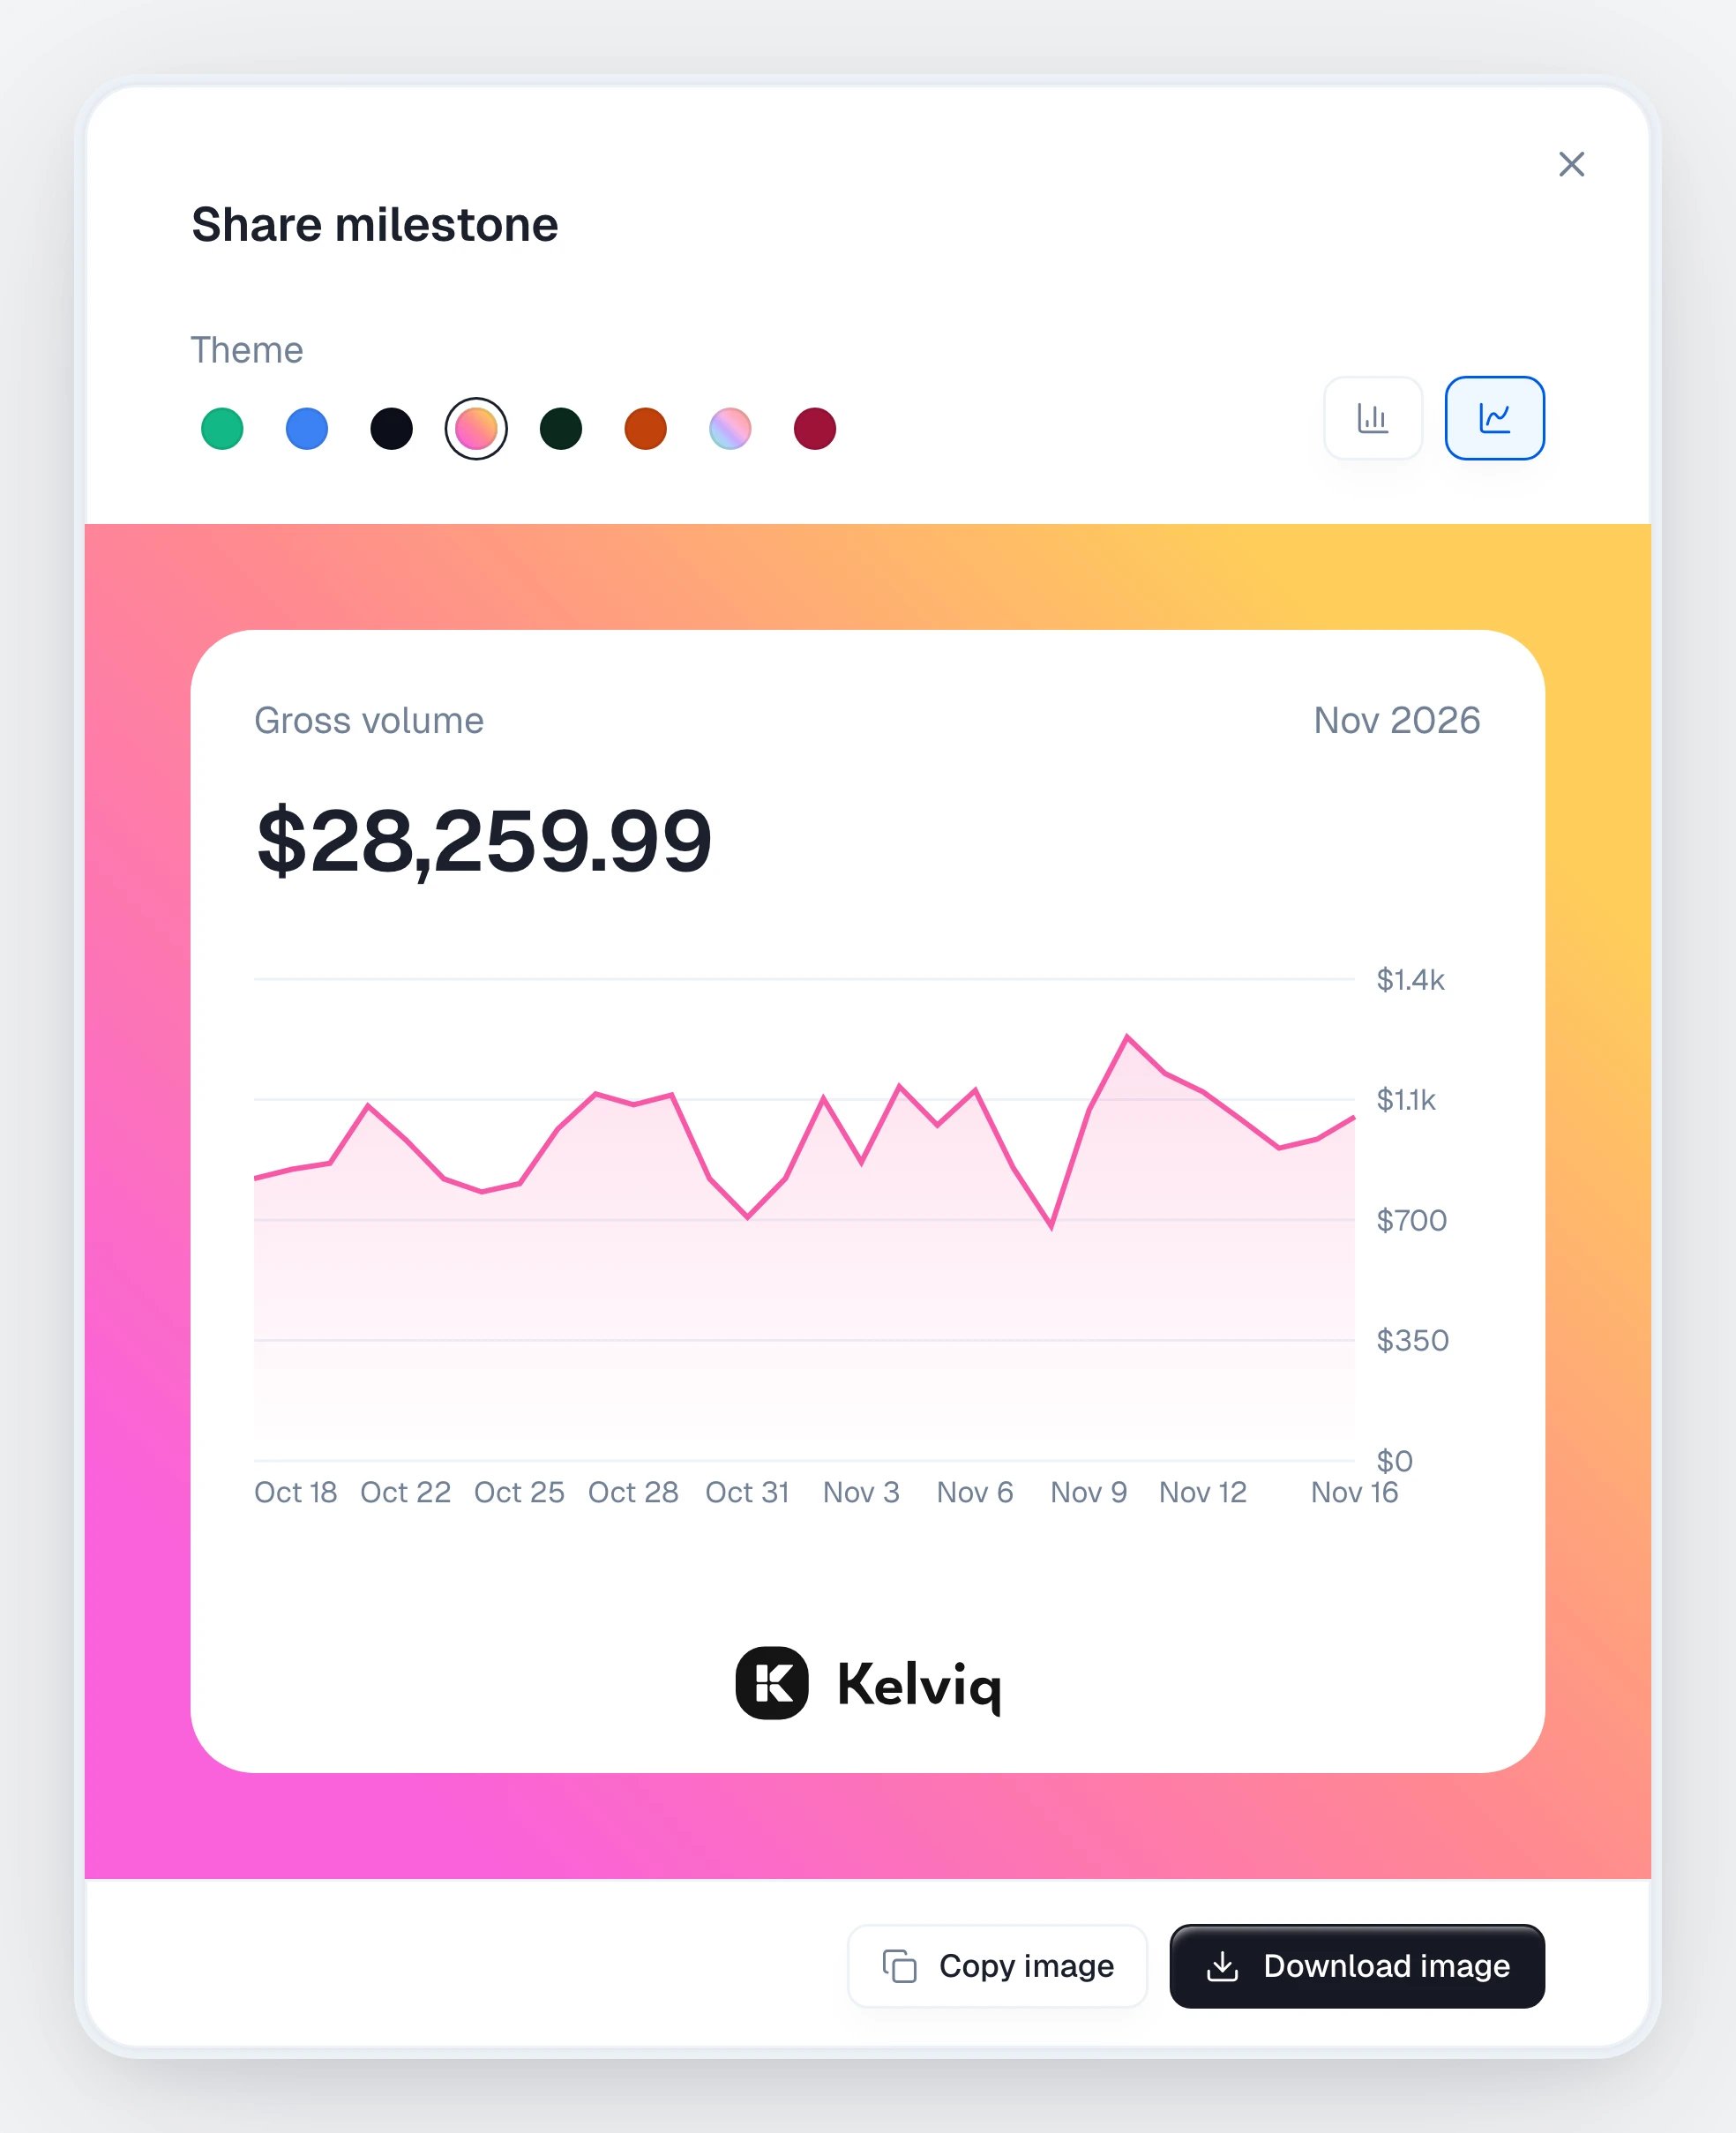
Sunset theme, line chart
Questions
Why doesn't a product or country filter change Payouts received?
Why doesn't a product or country filter change Payouts received?
Payouts are paid for the whole organization, not per product or country, so that card ignores both filters.
Why is Quick ratio or Modeled LTV shown as a dash?
Why is Quick ratio or Modeled LTV shown as a dash?
Quick ratio needs some lost MRR to divide by, and Modeled LTV needs some customer churn. Until there is, the card shows a dash instead of a number.
Can I see these numbers in sandbox?
Can I see these numbers in sandbox?
Yes. Analytics works in sandbox on your test data, which is a good way to see every card filled before you go live.